
Looker Studio Cross Joins Explained: From Basics to Advanced Reporting
Welcome to the advanced track of our Looker Studio journey! We've explored the fundamentals of data transformation, traveled through the various techniques of data blending, and now we arrive at perhaps the most powerful (and potentially dangerous) join type: the Cross Join.
In this focused guide, we'll unpack everything you need to know about Cross Joins in Looker Studio - from understanding their basic mechanics to implementing advanced data scaffolding techniques that can solve real-world analytics challenges. As Looker Studio experts know, mastering Cross Joins can dramatically expand what's possible with your data visualization projects.
Ready to harness the full power of data blending? Let's dive in.
What is a Cross Join?
The Cartesian Product of Your Data
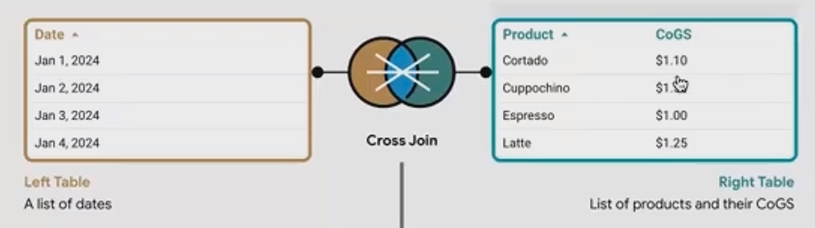
A Cross Join is fundamentally different from other join types we've explored in previous lessons. While Left, Right, Inner, and Full Outer joins all rely on matching records based on join keys, a Cross Join doesn't require any join keys at all.
Instead, it creates what mathematicians call a Cartesian product - it returns every possible combination of rows from the tables being joined. For each row in the left table, it returns every single row from the right table.
Let's visualize this with a simple example:
When we Cross Join these tables, we get:
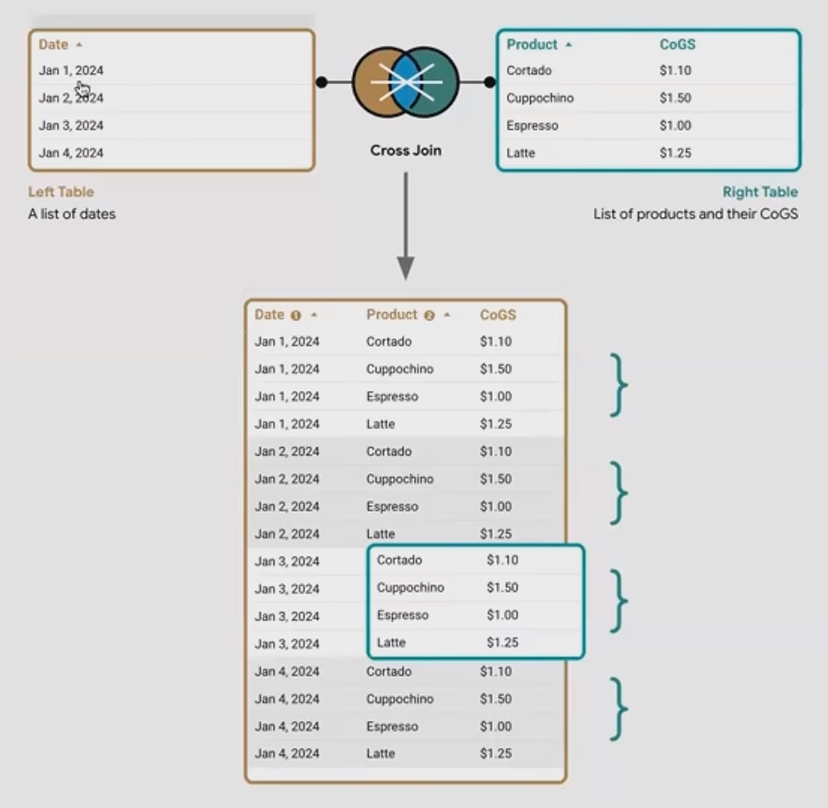
A Cross Join creates every possible combination between tables, expanding your dataset exponentially.
This results in 16 rows (4 dates × 4 products), where each date is paired with each product.
When to Use Cross Joins (With Caution)
Because Cross Joins multiply your data exponentially, they can quickly create enormous datasets that might slow down or even crash your reports. With two tables of 100 rows each, a Cross Join would produce 10,000 rows!
So when should you use them? Cross Joins are ideal when you need to:
Create a complete dataset with all possible combinations
Generate a "master template" for your data
Fill in gaps in sparse datasets
However, always use them judiciously and with tables that won't result in an unmanageable number of rows.
The Data Scaffolding Technique: A Practical Use Case
The Problem: Incomplete Data
One of the most powerful applications of Cross Joins is creating what's called a "data scaffold" or "data spine." This technique solves a common reporting challenge: incomplete or sparse data.
Imagine this scenario: You manage a retail business with 5 stores across major cities. Each store has 8 departments. You want to analyze sales data for the first few days of January, but the data is incomplete - some stores didn't sell anything from certain departments on certain days.
If you build a report directly from this sparse data, you'll only see entries where sales occurred. Any store-department-date combination with zero sales simply won't appear in your report, making it difficult to identify true "zero" performance versus missing data.
The Solution: Building a Complete Data Framework
Here's where Cross Joins save the day. We can create a comprehensive scaffold that includes every possible combination of dates, stores, and departments:
Table 1: Dates - Contains all dates we want to report on (e.g., January 1-3)
Table 2: Stores - Lists all store locations (5 stores)
Table 3: Departments - Contains all department names (8 departments)
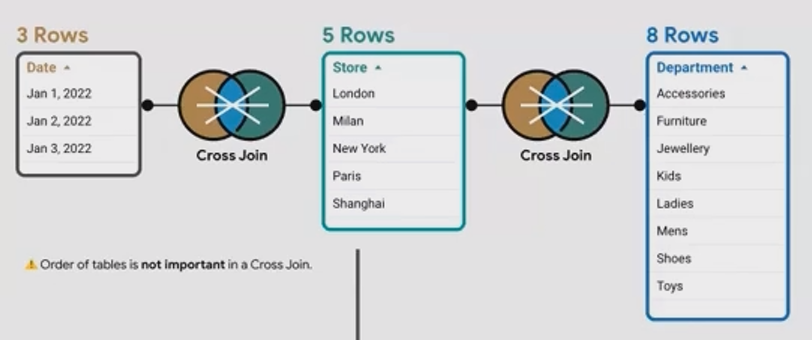
When we Cross Join these three tables together, we get a master dataset with 120 rows (3 dates × 5 stores × 8 departments). This represents every possible combination, creating a complete framework for our data.

Implementing the Data Scaffolding Technique
Let's walk through the implementation step by step:
Create Your Scaffold
Start with three simple tables: Dates (3 rows), Stores (5 rows), and Departments (8 rows)
Cross Join them together in Looker Studio by selecting all three tables and using the Blend Data option
This creates your master scaffold with all 120 possible combinations
Join With Your Actual Data
Add your sales data as a fourth table in the blend
Configure it as a Left Outer Join, using Date, Store, and Department as your join keys
This ensures that every possible combination is preserved, with actual sales data where it exists
Handle Missing Values
For combinations without sales, you'll see NULL values
Create a calculated field to convert NULLs to zeros:
IFNULL(Sales, 0)Now you have a complete dataset showing true zeros for combinations without sales
This technique is invaluable for creating accurate time series, heatmaps, or any visualization where you need to show the complete picture - including the absence of data.
Advanced Cross Join Tips and Techniques
Optimizing Performance with Filtered Scaffolds
When building data scaffolds, you can optimize performance by limiting your scaffold to only the combinations you actually need. For example:
Instead of using all 365 days of the year, use only the date range relevant to your analysis
If certain store-department combinations don't exist (e.g., not all stores have all departments), pre-filter these before creating your scaffold
Creating Multi-Metric Scorecards
A simple but powerful use of Cross Joins is blending two single-metric scorecards together. Since each scorecard contains just one value, Cross Joining them simply returns both values side by side, which you can then use in calculations or comparisons.
Handling Order of Operations in Multi-Table Blends
Remember that Looker Studio processes blends sequentially from left to right. With Cross Joins, this means:
The first two tables are Cross Joined
The result is then joined with the third table
That result is joined with the fourth table, and so on
This sequential processing is crucial to understand when building complex blends involving multiple join types.
Frequently Asked Questions (FAQs)
How do I troubleshoot a "System Error" when trying to create a Cross Join?
System errors in Looker Studio can be frustrating. For Cross Join errors specifically:
Refresh the page and data sources
Check if any filters or sorting applied to your tables are incompatible with the new blended data
Verify that your blended table doesn't exceed Looker Studio's row limits
Define calculated fields at the data source level rather than the chart level to prevent cross-filtering issues
Can I use a Cross Join to combine results from different ad channels?
Yes! This is actually a perfect use case. Create a table of dates as your scaffold, then Left Join it with data from each ad channel (Google Ads, Meta Ads, etc.). This ensures you have entries for every date, even for dates when certain channels had no spend or activity.
What's the difference between using a Cross Join and using multiple data sources with date range comparison?
While date range comparison (e.g., year-over-year) can be done with a single data source, Cross Joins give you much more flexibility. You can compare arbitrary periods, create custom comparison metrics, and build more complex analyses that go beyond simple period-over-period comparisons.
Cross Joins might initially seem like an advanced or niche feature, but they solve real-world problems that many analysts and marketers face daily. By mastering the data scaffolding technique, you can create comprehensive reports that show the complete picture - including what's missing.
While we've primarily focused on retail sales in our examples, the same principles apply to virtually any domain: marketing campaign performance, website analytics, inventory management, or financial reporting. Anywhere you need to ensure completeness in your data visualization, the Cross Join is your powerful ally.
Remember, with great power comes great responsibility. Use Cross Joins judiciously, keeping an eye on row counts to maintain performance. When implemented thoughtfully, they'll transform how you approach data completeness in your Looker Studio reports.
Ready to take your Looker Studio skills to the next level? Apply these techniques to your next project and watch how they elevate your data storytelling capabilities.
Note:
This post is based on a subject covered in the Looker Studio Masterclass Program. To learn more about Looker Studio Masterclass, click here.