
The Looker Studio Self-Blend Technique for Advanced Data Analysis
Have you ever tried to compare this week's performance with the same day last week in Looker Studio, only to find yourself stuck with limitations in table visualizations? Or perhaps you've wanted to identify which customer paid the highest price for each product but couldn't figure out how to connect these data points? If these challenges sound familiar, you're about to discover one of Looker Studio's most powerful yet underutilized features: the self-blend.
In today's post, we're diving deep into self-blends—a technique that can transform your data analysis capabilities and help you solve complex business questions that would otherwise require advanced SQL knowledge.
What Is a Self-Blend and Why Should You Care?
A self-blend is exactly what it sounds like: blending a data source with itself. While this might initially sound redundant, it's actually an ingenious technique that allows you to:
Compare data across different time periods within the same row
Perform calculations that would typically require SQL window functions
Identify outliers and top performers across different categories
Unlike a single-table blend (which we've covered previously), where we blend a table with itself to de-aggregate and then re-aggregate data, a self-blend involves joining actual separate instances of the same table to enable new analytical possibilities.
Let's explore how this works with two practical, real-world examples.
Example 1: Comparing This Week with Same Day Last Week
The Business Challenge: Your marketing team wants to see how each channel's performance this week compares with the same day last week—not just in a chart, but in a detailed table.
The Problem: While time series charts in Looker Studio handle this comparison effortlessly (using the built-in "Compare to previous period" feature), tables fall short. When you apply the same settings to a table with Date as a dimension, the comparison data simply disappears.
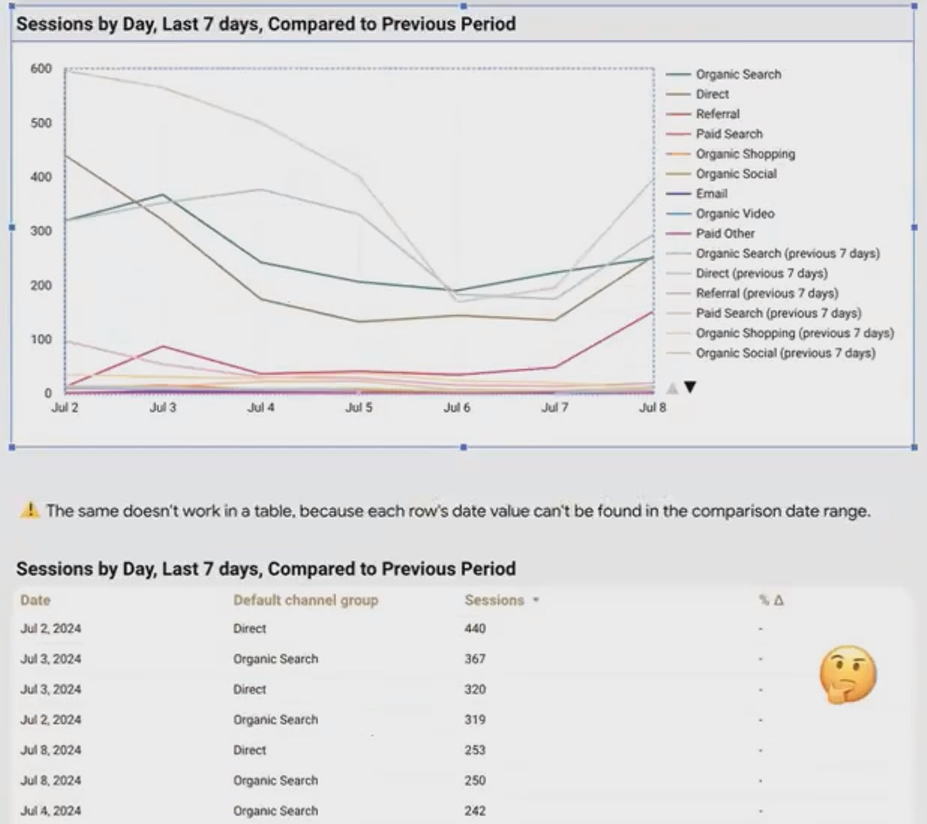
A time series chart displays both current and previous period data, but a table with Date as a dimension cannot show the comparisons.
Why This Happens: A table requires an exact match for the entire row's dimension values. The row for "July 5th, Organic Search" doesn't exist in the previous period's data (that data is labeled "June 28th, Organic Search"). Since the join key (Date + Channel) doesn't match, Looker Studio can't retrieve the comparison value.
The Self-Blend Solution:
Here's how to solve this with a self-blend:
Create a new blend with your data source (like GA4) added twice—once as the "Current Week" table and once as the "Last Week" table.
Configure the join keys:
Join on
Default Channel Grouping(or whatever channel dimension you're using)For the date, we need a clever workaround
Create a calculated date join key in the "Last Week" table:
DATE(DATETIME_ADD(Date, INTERVAL 7 DAY))This formula takes the date from seven days ago and adds 7 days to make it match today's date. For example, it transforms "June 28th" into "July 5th" so the join keys will match.
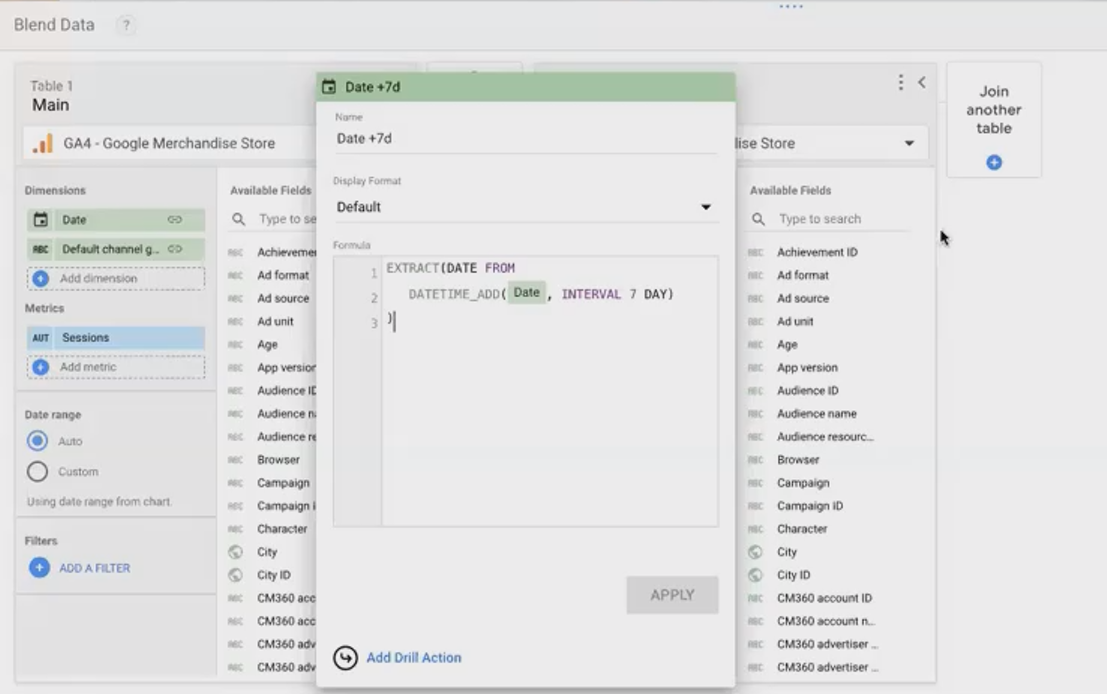
The self-blend configuration showing the date transformation formula that aligns dates from different weeks.
The Result: Now you have a table with two separate metrics (current week's sessions and last week's sessions) in the same row. Because they're independent metrics, you can:
Display both values side by side
Calculate the absolute change between weeks
Calculate the percentage change
Apply conditional formatting based on performance
This gives you significantly more flexibility than the default comparison feature and solves the table visualization limitation.
Example 2: Finding Who Paid the Highest Price for Each Product
Let's tackle a more complex scenario that demonstrates the power of self-blends for simulating SQL window functions.
The Business Challenge: Your e-commerce team wants to identify which customer paid the highest price for each product you sell.
The Dataset: Imagine you have three tables:
Products: Product SKU, Product Name
Users: User ID, User Name
Sales: User ID, Product SKU, Price Paid
The Problem: While finding the maximum price paid for each product is straightforward (using MAX aggregation), connecting that maximum price back to the specific user who paid it requires more sophisticated analysis.
The Self-Blend Solution:
This multi-step blend strategy essentially simulates a SQL window function:
First, create an aggregated view that finds the maximum price for each product:
Group by:
Product SKUMetric:
MAX(Price)
Now for the self-blend magic:
Left Table: The raw, unaggregated Sales data (User ID, Product SKU, Price Paid)
Right Table: The aggregated table with Product SKU and Max Price
Join Keys: Product SKU = Product SKU AND Price = Max Price
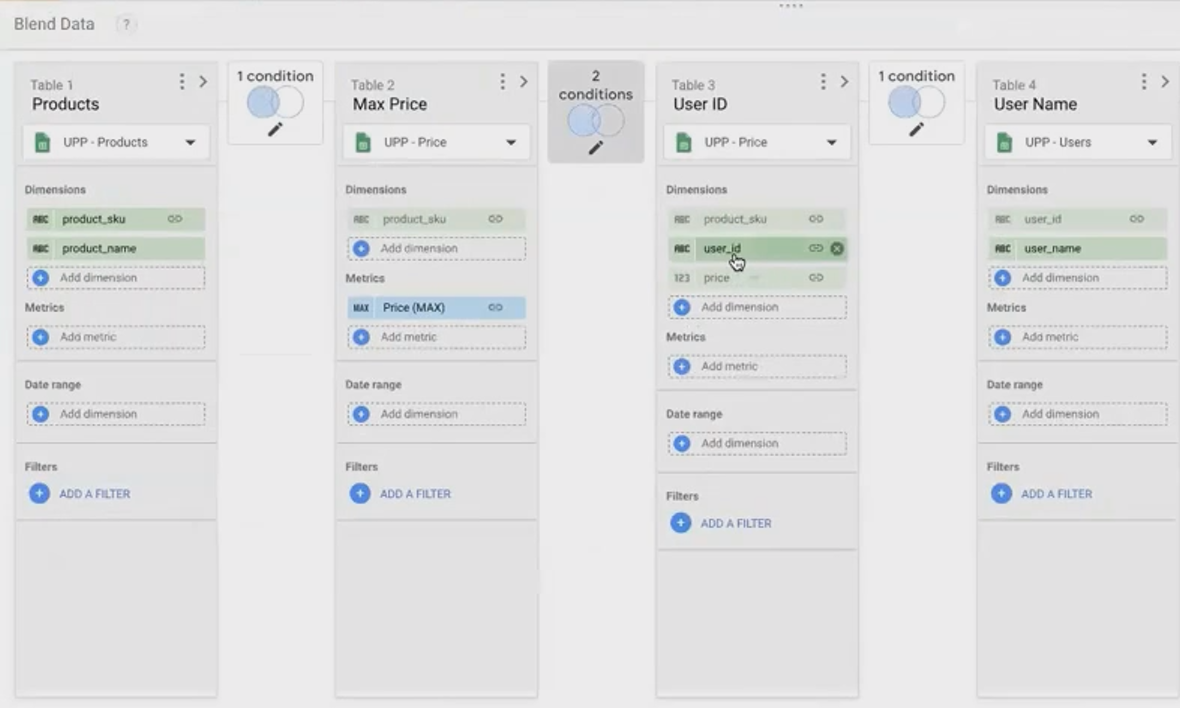
The self-blend configuration that simulates a SQL window function by joining on both product ID and the maximum price.
This join returns only the rows where a customer paid the maximum price for a particular product. From there, you can connect to your Users and Products tables to get the full picture: Product Name, Maximum Price, and the User Name who paid that amount.
In SQL, this would require a complex window function with partitioning. With Looker Studio's self-blend technique, you can achieve the same result with a more visual, no-code approach.
When to Use Self-Blends
Self-blends are particularly useful when:
You need to compare the same metrics across different time periods within the same row
You want to identify top or bottom performers within categories
You need to calculate ranks, percentiles, or running totals
You're trying to simulate SQL window functions without writing SQL
While not every analysis requires a self-blend, having this technique in your toolkit can help you solve complex business questions that would otherwise require custom SQL queries or external data preparation.
Practical Tips for Successful Self-Blends
Based on my experience implementing self-blends for clients, here are some practical tips:
Plan your join keys carefully: The success of a self-blend depends on properly matched join keys. Sketch out what fields need to match (or be transformed to match) before building.
Use appropriate naming conventions: Since you're blending the same data source twice, clear field naming is crucial. I recommend adding prefixes like "Current_" and "Previous_" to avoid confusion.
Be mindful of performance: Self-blends can increase the computational load on your reports. If performance becomes an issue, consider pre-aggregating data in a separate tool or database.
Document your approach: Self-blends can look like magic to colleagues who aren't familiar with the technique. Include explanatory text boxes in your dashboard to explain the methodology.
Frequently Asked Questions (FAQs)
Can I use self-blends with any data source in Looker Studio?
Yes, self-blends work with any data source that supports blending, including Google Analytics, Google Sheets, BigQuery, and most database connectors.
Why doesn't Looker Studio's built-in comparison feature work for tables with date dimensions?
The comparison feature requires exact dimension value matches. Since dates from different periods don't match (e.g., July 5th vs. June 28th), the comparison fails for tables, though it works for time series charts which are specifically designed to handle temporal mapping.
Is there a limit to how many instances of the same data source I can blend?
Looker Studio allows up to 5 data sources in a blend, so you could potentially have multiple instances of the same source, though in practice, 2-3 instances are typically sufficient for most use cases.
Can I use calculated fields as join keys in a self-blend?
Absolutely! As demonstrated in our examples, calculated fields are often essential for creating effective self-blends, especially when you need to transform values to create matching join keys.
Self-blends represent a powerful technique that can elevate your Looker Studio reports from basic visualizations to sophisticated analytical tools. By understanding and applying this concept, you can answer complex business questions directly within Looker Studio without resorting to external data manipulation.
Have you tried using self-blends in your Looker Studio reports? What complex problems have you solved with this technique? Share your experiences in the comments below!
Note:
This post is based on a subject covered in the Looker Studio Masterclass Program. To learn more about Looker Studio Masterclass, click here.