
Looker Studio Parameters: Collect User Input & Build Dynamic Dashboards
Hey there, data enthusiasts! If you've been using Looker Studio (formerly Google Data Studio) for a while, you're probably familiar with creating dashboards that pull data from Google Analytics, spreadsheets, or databases. But what if you want to collect information directly from the person viewing your report? That's where parameters come in – and they're absolute game-changers.
In today's post, I'm going to walk you through everything you need to know about parameters in Looker Studio – from setting them up to creating interactive experiences that will make your stakeholders say "wow!"
What Are Parameters and Why Should You Care?
Think of parameters as variables that collect and store information provided by your report viewers. Before parameters existed, Looker Studio could only display data from connected data sources (like Google Analytics or spreadsheets). There was no way to incorporate viewer input directly into your visualizations or calculations.
Now, with parameters, you can:
Collect numeric values (like profit margins or conversion targets)
Capture text input (like product names or campaign tags)
Record boolean (true/false) selections from your viewers
Use these inputs in real-time calculations and visualizations
This creates countless possibilities for scenario planning, goal setting, and personalized dashboards!
Let me show you a practical example: Imagine you have revenue data from your CRM displayed in your Looker Studio report. With parameters, you can add an input field where viewers enter their target profit margin percentage. The dashboard instantly calculates and displays the estimated profit based on that input – creating a personalized planning tool!
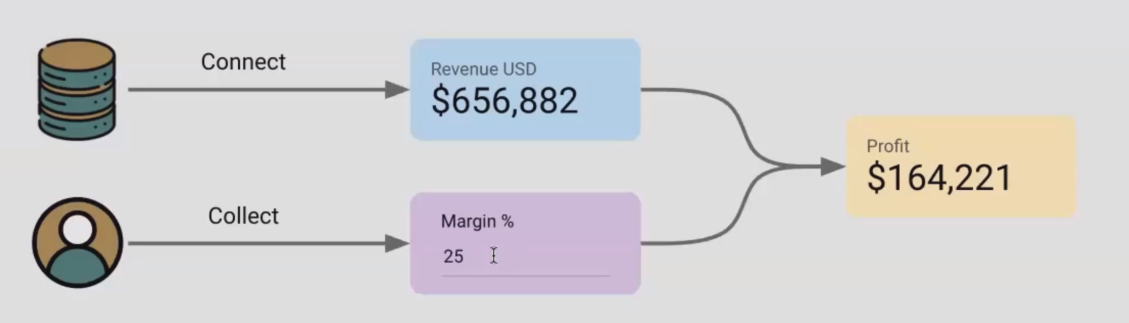
Parameters allow viewers to enter their own values (like profit margin) and see instant calculations based on their input.
Now that you understand the power of parameters, let's dive into how to set them up and use them effectively.
Defining Parameters: The Foundation
Parameters are defined within a data source, much like dimensions and metrics. Here's how to create one:
Open your report in Edit mode
Click on your data source (e.g., "Leads and Sales")
Click "Edit data source"
Click "Add a parameter" at the top of the fields list
When creating a parameter, you'll need to configure:
Parameter Name: A descriptive label (e.g., "Profit Margin")
Parameter ID: Automatically generated; used in calculations
Data Type: Choose from:
Number (Whole or Decimal)
Text
Boolean (True/False)
Permitted Values: Control what values viewers can enter
Any value: No restrictions
List of values: Predefined options for selection
Range: For numbers, set minimum and maximum values (e.g., 0-100 for percentages)
Default Value: The initial value shown before viewer interaction
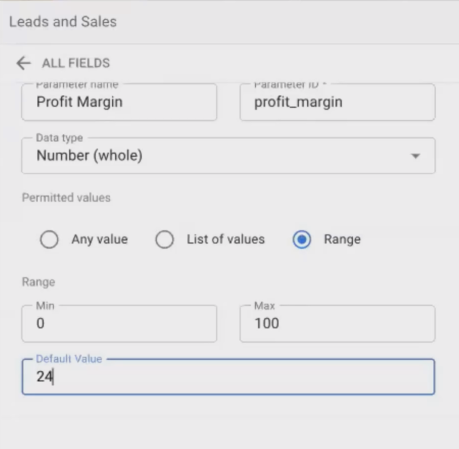
When defining a parameter, choose its type, allowed values, and default setting carefully.
Pro Tip:
For percentage parameters like profit margins, use a number with range restrictions (0-100) to prevent nonsensical inputs. No business has a 500% profit margin, and negative values wouldn't make sense in most contexts!
Collecting Parameter Values: The Input Methods
Using Input Box - Slider - Checkbox Controls as “Input”
Now that you've defined your parameter, you need a way for viewers to provide values. This is where controls come in.
To add a control for collecting parameter values:
In Edit mode, click "Add a control" in the toolbar
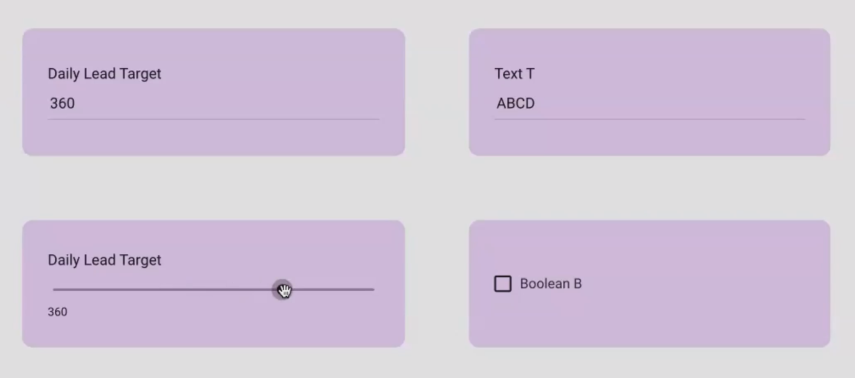
Choose an appropriate control type:
Input box: For text or numbers
Slider: For numbers with a defined range
Checkbox: For boolean (true/false) parameters
Place the control on your canvas
In the control's setup panel, select your parameter as the "Control field"
Different parameters work with different controls:
| Parameter Type | Compatible Controls |
|---|---|
| Number | Input box, Slider |
| Text | Input box |
| Boolean | Checkbox |
Styling Your Parameter Controls
While optional, I recommend visually distinguishing parameter controls from filter controls (which filter existing data). In my teaching, I use purple backgrounds for parameter controls since parameters appear in purple in Looker Studio's interface.
This subtle visual cue helps both you and your viewers understand which controls are collecting new data versus filtering existing data.
Using Parameter Values: Where the Magic Happens
Once you've defined parameters and set up controls to collect values, the real fun begins! There are three main ways to use parameter values in your reports:
1. Displaying Parameter Values Directly
The simplest use is to show the parameter value itself:
Add a Scorecard to your report
Drag your parameter from the "Available fields" list into the "Metric" field
Format as needed (e.g., add % sign for percentages)
This creates a visual confirmation that the parameter value was received and provides context for other calculations.
2. Using Parameters in Calculated Fields
This is where parameters become truly powerful:
Create a calculated field in a chart or directly in the data source
Reference your parameter in the formula, for example:
Revenue * (Profit_Margin_Parameter / 100)to calculate profitSUM(Leads) - (Daily_Lead_Target_Parameter * Days)to calculate leads vs. target
Calculated fields can combine parameters with existing metrics to create new insights that weren't possible before.
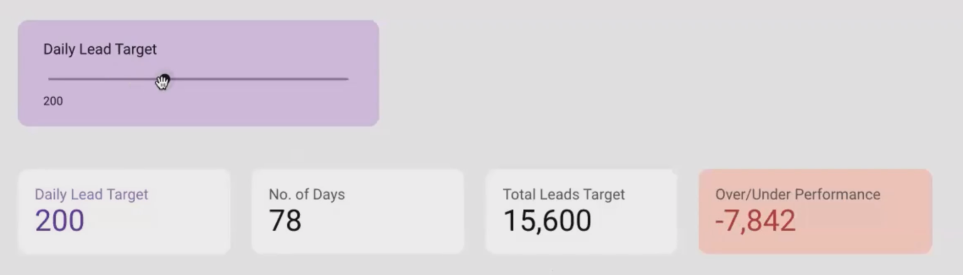
For example, if a viewer sets their daily lead target to 200, and your date range covers 78 days, you can calculate:
Expected leads: 200 × 78 = 15,600
Actual leads: (from your data source)
Variance: Actual - Expected
This dynamic calculation adjusts whenever the viewer changes either their lead target or the date range!
3. Using Parameters in Chart Reference Lines
For time series or other charts with axes, parameters can create dynamic reference lines:
Select your chart
Go to the Style panel
Add a reference line
Set the "Type" to "Parameter" and select your parameter
This visually shows targets or thresholds that change based on viewer input. For instance, a daily lead target becomes a horizontal reference line on your time series chart, making it easy to spot when performance was above or below target.
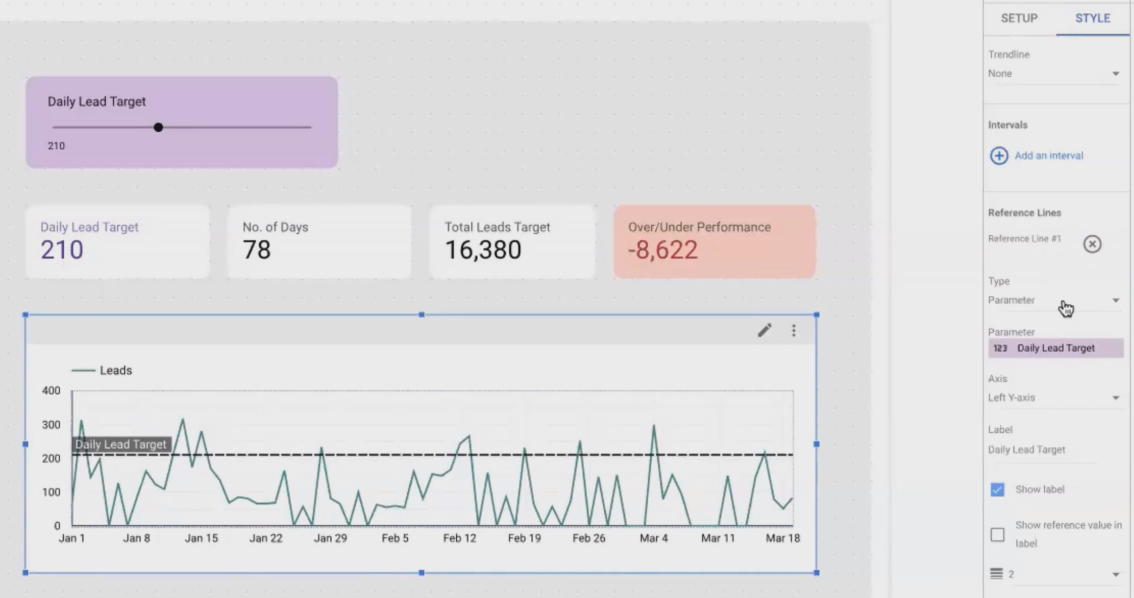
A parameter-driven reference line helps viewers quickly identify periods of over/under performance.
Real-World Applications of Parameters
Let's explore some practical uses for parameters that you can implement today:
Scenario Planning
Allow stakeholders to input different growth rates, conversion rates, or cost assumptions to see how they impact projections.
Target Setting and Variance Analysis
Compare actual performance against user-defined targets and automatically calculate variances.
ROI Calculators
Let viewers input their cost structure to see personalized ROI calculations based on the performance data in your report.
Budget Allocations
Create what-if scenarios for different budget distributions across channels or products.
Personalized KPI Dashboards
Let each department or team member enter their own targets to create a personalized performance dashboard.
Frequently Asked Questions (FAQs)
Can parameter values come from a data source instead of user input?
No, by definition, parameters are designed to collect viewer-provided input. If you need values from your data source, use regular dimensions or metrics. However, you can set default parameter values or pre-populate them through URL parameters.
Can I use multiple controls for the same parameter?
Yes! You can have both a slider and an input box connected to the same parameter. When the value changes in one control, it automatically updates in the other.
How do I reset parameter values to their defaults?
Unlike filters, individual parameters don't have a reset button. You need to manually change the value back to the default, or reload the report. Consider adding a text note with the default values for reference.
Can I hide parameters in view mode?
Not directly. If you want to create a report with fixed parameters, you can set them up but not add controls to the canvas. Alternatively, you can pass parameter values through the URL.
Do parameters work with all data sources?
Yes, parameters are universal and work with any data source in Looker Studio. They exist as a separate entity that can interact with any of your data.
How many parameters can I add to a report?
While there's no strict published limit, performance may degrade with too many parameters. Most reports work well with 5-10 parameters; beyond that, consider whether some could be consolidated.
Wrapping Up: The Power of Interactivity
Parameters represent a fundamental shift in what's possible with Looker Studio. They transform static reports into interactive tools that respond to user input and provide personalized insights.
The key to successful implementation is thoughtful planning:
Identify where user input would add genuine value
Choose the appropriate parameter types and controls
Design clear visual feedback showing how the input affects the output
When implemented well, parameters can dramatically increase engagement with your reports and help stakeholders connect more deeply with the data that matters to them.
What parameter-driven experiences will you create in your next Looker Studio report? The possibilities are truly endless!
Note:
This post is based on a subject covered in the Looker Studio Masterclass Program. To learn more about Looker Studio Masterclass, click here.