
AI-Boosted Data Analysis: How to Leverage Gemini in Looker Studio While Staying in Control
In today's data-driven world, the ability to quickly transform raw numbers into meaningful insights can make or break business decisions. Looker Studio has long been a powerful tool for data visualization, but with the introduction of Gemini AI features in July 2024, it's now entering a new era of intelligent analytics. In this guide, I'll walk you through how to harness these AI capabilities while maintaining control of your data storytelling process.
What Does "AI-Boosted" Actually Mean?
When I talk about "AI-boosted" workflows, I'm not suggesting we hand over the keys to artificial intelligence and hope for the best. Instead, I'm advocating for a strategic approach where AI amplifies your existing skills in three critical ways:
Expanding your capabilities: Using AI to perform tasks you couldn't otherwise do (like writing complex SQL when your SQL skills are limited)
Increasing your efficiency: Transforming a process that might take hours into one that takes minutes
Improving your accuracy: Reducing human error through AI-assisted checking and analysis
The key distinction is that you remain in control throughout the process. Think of AI as your extremely capable assistant rather than a replacement for your expertise.
The Control Framework: When to Use AI (And When Not To)
Before incorporating AI into your Looker Studio workflow, ask yourself these three questions:
About the Task: Do I have a clear idea of what outcome I'm looking for?
About the Process: Could I complete this task manually (given enough time)?
About the Result: Can I verify that the AI's output is correct?
This framework helps categorize your AI use into three scenarios:
🟢 Boosting (Low Risk)
You can do the task yourself and verify the result. You're simply using AI to work faster.
🟡 Enabling (Calculated Risk)
You cannot do the task yourself, but you can verify the result is correct (like using AI to create a data visualization style you couldn't make yourself, but you can tell if the resulting chart accurately represents your data).
🔴 Gambling (High Risk)
You cannot do the task and cannot verify the result. This is where professionals should tread carefully or avoid entirely.
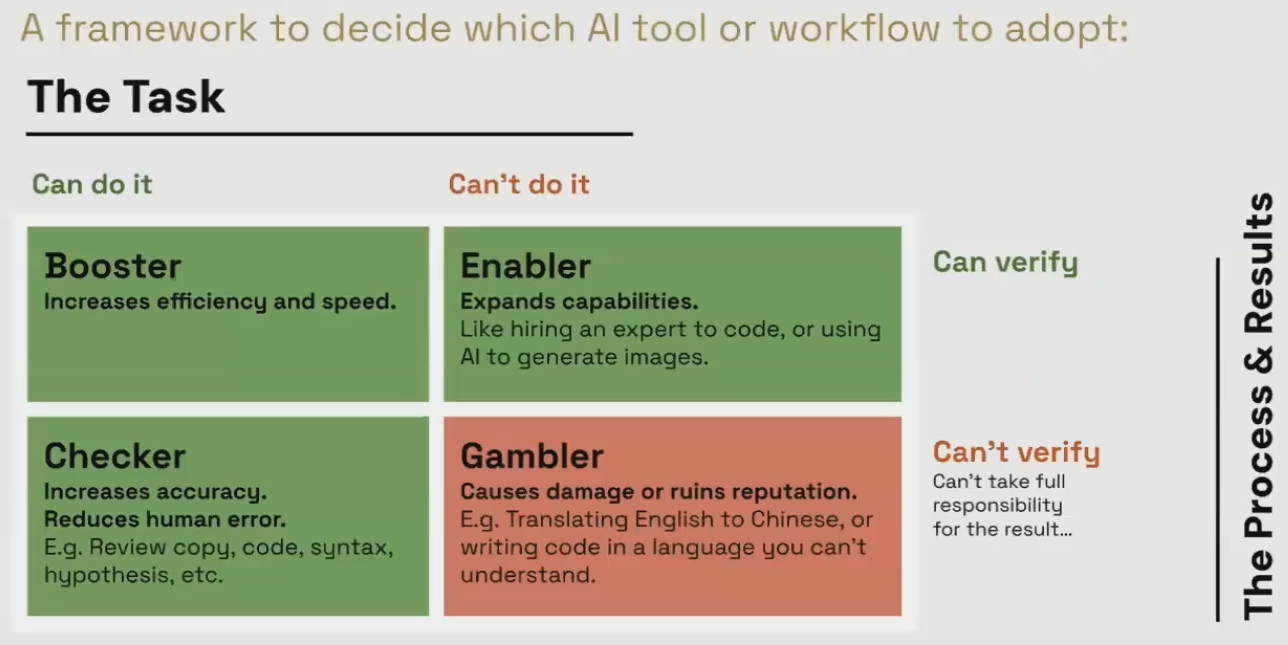
The AI Control Framework helps determine when AI use is appropriate in your analytics workflow.
Understanding the Data Value Journey
To effectively apply AI, we need to understand where it fits in the journey from raw data to business value:
The Traditional Path (Human-Centered)
Raw Data → Collection → Cleaning → Transformation → Visualization → Human Analysis → Action → ValueLooker Studio traditionally operates in the visualization stage, making data digestible for human analysts to derive insights.
The Automated Path (Machine-Centered)
Raw Data → Collection → Cleaning → Machine Analysis → Automated Action → ValueThis is how platforms like Google Ads work, where machines analyze and act on data without human visualization.
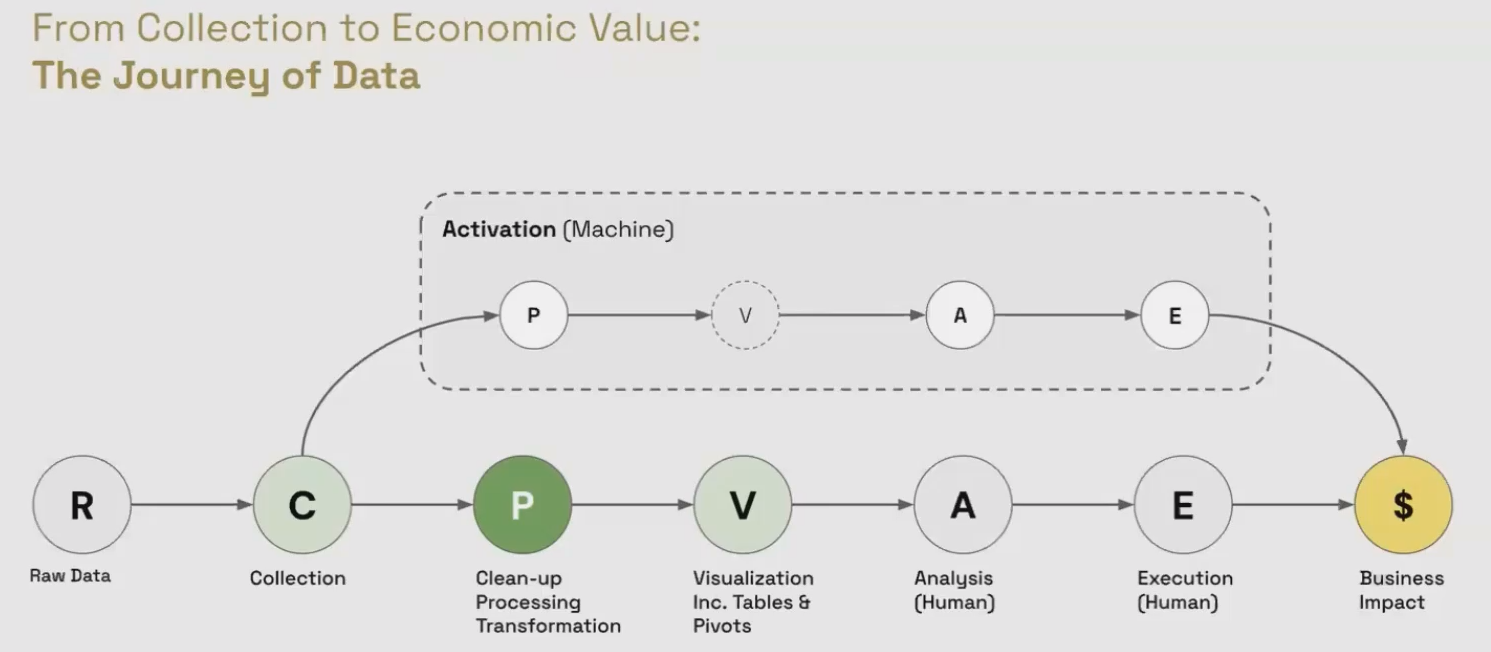
When integrating AI, knowing which path you're on helps determine the appropriate level of human oversight needed.
Real-World Example: AI-Boosted Customer Lifetime Value Analysis
Let's see how this works in practice with a common business need: calculating customer lifetime value from e-commerce transaction data.
The Challenge
We have a BigQuery table containing 100,000 rows of customer transaction data. We need to:
Calculate key LTV metrics for each customer
Visualize the results in Looker Studio
Maintain control throughout the process
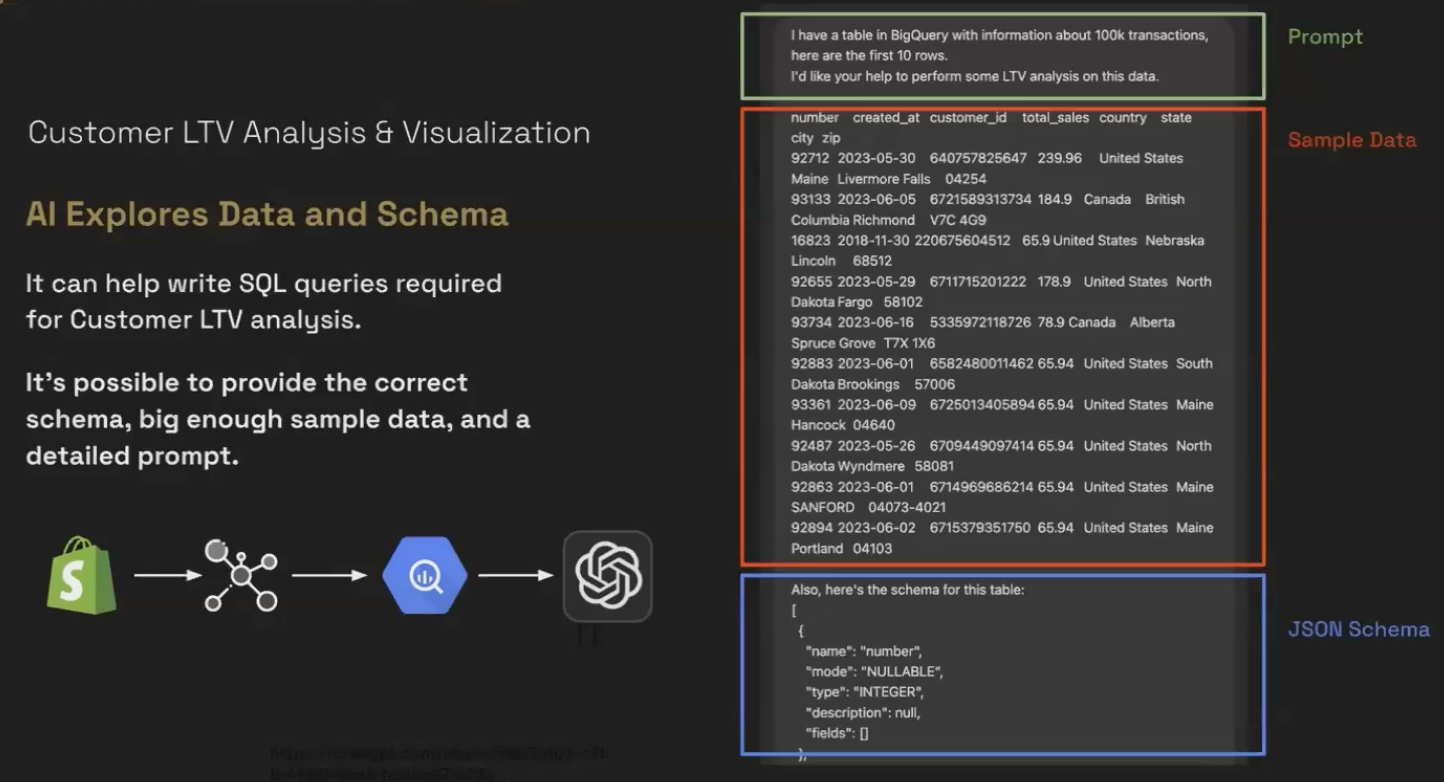
Step 1: Preparing the Context for AI
Rather than dumping our entire dataset into an LLM (which would exceed token limits and create privacy concerns), we provide:
A small representative sample (first 10 rows)
The complete JSON schema of our table
This structured approach gives the AI enough context to help without exposing all your data.
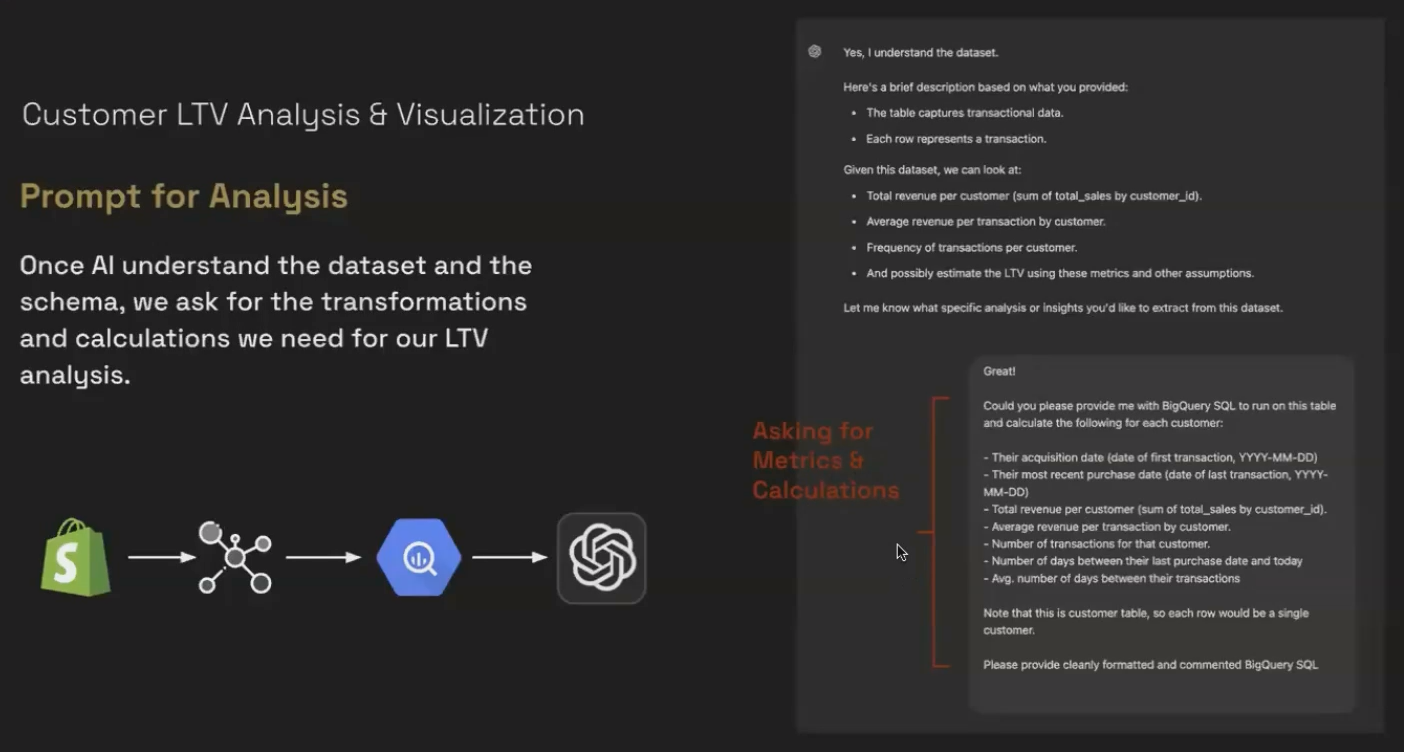
Step 2: Requesting Specific SQL
Once the AI confirms understanding, we make a very specific request:
Step 3: Verification and Execution
The critical step is to review this code before running it. Since we know SQL, we can verify the logic makes sense. This is the "process verification" part of our framework.
After running the verified query in BigQuery, we can save it as a view for easy access in Looker Studio.
Step 4: Was This a "Boost" or a "Gamble"?
This was clearly a Boost because:
We had a specific goal (calculate LTV metrics)
We could have written the SQL ourselves (just slower)
We could verify both the process (by reading the SQL) and the results (by examining the output table)
Frequently Asked Questions (FAQs)
How do I know if the AI-generated SQL is optimized for performance?
While AI can generate functional SQL, you may need to optimize it for large datasets. Look for inefficient joins, missing indexes, or unnecessary calculations. If you're working with massive datasets, have a database expert review the generated code.
Can I upload my entire dataset to Chat GPT to analyze?
This is not recommended for several reasons: token limits will truncate your data (often without warning), data privacy concerns exist, and most importantly, you lose the ability to verify what calculations were performed. The better approach is to provide schema and sample data, then run the AI-generated queries in your own environment.
Is it better to use Chat GPT or Gemini for data analysis tasks?
Both can generate SQL, but the best choice depends on your specific needs. For Google-specific products like BigQuery and Looker Studio, Gemini may have more up-to-date knowledge of syntax and features. However, the framework I've outlined works with any LLM.
How can I get my data from platforms like Shopify into BigQuery for this kind of analysis?
Without a native connector, you have several options: manually export to Google Sheets and connect to BigQuery, use third-party connectors like Supermetrics, or implement a custom pipeline with tools like Hevo Data.
Once we've transformed our data using AI-assisted methods, visualization becomes the bridge between raw numbers and human understanding. Looker Studio excels at this crucial step in the data value journey.
Remember that data only delivers economic value when:
Someone analyzes it correctly
That analysis leads to action
The action creates business impact
The visualization stage is where our transformed data becomes accessible to decision-makers, who can then derive insights and take action.
The most important lesson is that AI should serve as your copilot, not your autopilot. By applying the control framework we've discussed, you can leverage AI to boost your data transformation and visualization processes while maintaining professional standards and accountability.
In the next part of this series, we'll explore the powerful Gemini AI features in Looker Studio Pro, including Conversational Analytics, Formula Assistant, and Generative Google Slides.
Note:
This post is based on a subject covered in the Looker Studio Masterclass Program. To learn more about Looker Studio Masterclass, click here.