
Looker Studio Speed Optimization: Transform Slow Dashboards with Data Transformation & Rendering Tricks
Have you ever opened a Looker Studio report only to watch that blue loading bar crawl across the top of your screen? Or perhaps you've built a beautiful dashboard that works perfectly with small datasets but grinds to a halt when connected to your full production data? You're not alone.
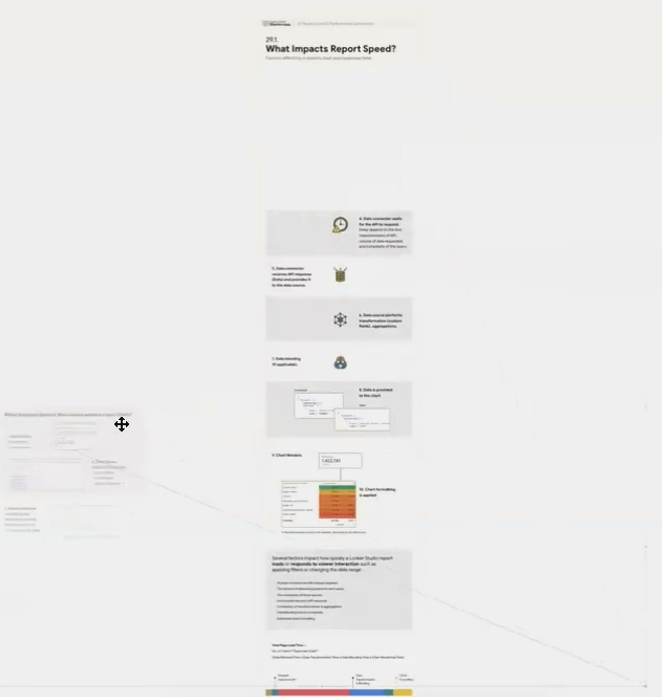
In this deep dive, we're going beyond the basic performance tips to explore the less obvious (but often more powerful) optimization strategies for Looker Studio. We'll focus on three critical areas that can transform a sluggish dashboard into a responsive analytical powerhouse:
Minimizing data transformation time within Looker Studio
Reducing chart rendering time for faster visual display
Optimizing the editor experience to make building reports less frustrating
Whether you're a consultant delivering reports to clients or an analyst creating dashboards for your organization, these advanced techniques will help you create reports that not only look professional but perform professionally too.
Minimizing Data Transformation Time: Let Looker Studio Visualize, Not Calculate
The most fundamental principle of Looker Studio optimization is understanding what the platform was designed to do and what it wasn't. Looker Studio excels at visualization but struggles with heavy data transformation.
The "Pre-Kitchen" Approach: Transform Before Looker Studio
Think of Looker Studio as a restaurant's dining room, not its kitchen. The heavy food preparation should happen before the meal reaches the dining area. Similarly, data preparation should happen before reaching Looker Studio.
Clean Your Data Upstream: Instead of using REGEX or CASE statements in Looker Studio to standardize messy data like source/medium values, clean this data in your warehouse or ETL process.
Pre-Join Related Tables: Looker Studio's data blending is essentially a simplified SQL JOIN performed on the fly. While convenient, it's significantly slower than performing the same join in a proper database.
Pre-Aggregate Where Possible: If your report shows monthly totals but your data is daily, consider pre-aggregating to the monthly level in your data source.
The Ratio Metric Exception: When to Calculate in Looker Studio
There's one important exception to the "transform before Looker Studio" rule: ratio metrics like conversion rates, click-through rates, and averages.
DON'T do this in your warehouse:

SELECT date, SUM(transactions)/SUM(sessions) as conversion_rate
FROM ga_data
GROUP BY date
Why? Because pre-calculated ratios cannot be correctly re-aggregated. If a user selects a custom date range, Looker Studio would incorrectly average the daily ratios instead of recalculating from the raw components.
Instead, bring the raw components into Looker Studio and create a calculated field:
DO this in Looker Studio:
SUM(transactions)/SUM(sessions)
This ensures accurate calculations regardless of the date range or filter selections.
Data Blending Best Practices: When You Must Blend in Looker Studio
Sometimes data blending in Looker Studio is unavoidable. When that's the case:
Create Multiple Focused Blends: Instead of one massive blend powering your entire report, create several smaller blends, each serving a specific section or visualization.
Minimize Dimensions in Each Blend: Every dimension you add to a blend exponentially increases the data volume. For example, adding both Country (200 values) and City (10,000 values) creates potentially 2 million combinations, even if you only need to display a handful.
Limit Metrics to What's Necessary: Just like dimensions, only include the metrics you actually need in your final visualization.
Reducing Chart Rendering Time: Simplify Your Visualizations
Even after your data has arrived, Looker Studio still needs to render the visual elements of your charts. This final step can be surprisingly resource-intensive, especially for complex visualizations.
Chart Type Matters: Choose the Right Tool for the Job
Chart rendering speed varies dramatically by visualization type:
Fast-Rendering Charts:
Scorecards
Simple tables
Basic bar charts
Line charts with few data points
Slow-Rendering Charts:
Google Maps (especially with many data points)
Tables with many rows and conditional formatting
Charts with excessive data labels
Visualizations with complex heatmaps
Choose the simplest visualization that effectively communicates your message. Sometimes a simple table with conditional formatting can convey the same information as a complex geo map, but load in a fraction of the time.
Conditional Formatting: Use Sparingly and Strategically
Conditional formatting is powerful but comes at a performance cost. Each formatting rule requires additional processing for every cell or data point. Some best practices:
Limit Rules to Key Metrics: Apply conditional formatting only to the most important values that need visual emphasis.
Use Simple Rules When Possible: A simple color scale based on a single field is faster than complex rules with multiple conditions.
Consider Pre-Calculated Indicators: For complex conditions, consider pre-calculating a simple indicator field (like "High/Medium/Low") in your data source, then applying conditional formatting to that single field.
The Page Strategy: Distribute Complex Visualizations
Remember that Looker Studio only loads the visualizations on the currently viewed page. Use this to your advantage:
Group Similar Chart Types: Place resource-intensive visualizations like maps on their own pages rather than mixing them with simpler charts.
Create a "Deep Dive" Flow: Start with summary pages containing fast-loading visualizations, then link to more detailed pages with heavier charts for users who need to explore further.
Optimizing the Editor Experience: Work Smarter, Not Slower
The optimization techniques we've discussed so far focus primarily on the viewer's experience. But what about you, the report creator? Here are some lesser-known tricks to make your editing experience smoother and less frustrating.
The Power of "Pause Updates"
One of Looker Studio's most underutilized features is the "Pause updates" button at the top of the editor interface. This simple toggle can dramatically improve your editing experience.
When updates are paused:
Looker Studio won't send API requests as you modify charts
You can make multiple changes to chart configuration without waiting
Moving and resizing elements becomes more responsive
You won't consume API quotas during the editing process
Simply click "Resume updates" when you're ready to see the results of your changes.

The "Pause updates" button is your secret weapon for a smoother editing experience.
The Browser Refresh Trick
As you work on a report, Looker Studio accumulates a history of your changes to enable undo/redo functionality. Over time, this can slow down the editor. A simple but effective trick:
Refresh Your Browser Regularly: Simply pressing F5 (or Cmd+R on Mac) can clear the session cache and history, making the editor more responsive.
For Stubborn Cases: Use a hard refresh (Ctrl+F5 or Cmd+Shift+R) to completely reload all resources.
The Zoom-Out Method for Smoother Editing
This unconventional trick can make a noticeable difference when moving objects around on your canvas:
Use your browser's zoom function to zoom out to 25-50% (Ctrl+- or Cmd+-)
Move or resize elements as needed
Zoom back in when finished (Ctrl++ or Cmd++)
While there's no official explanation for why this works, many Looker Studio power users report that it makes the interface significantly more responsive when arranging elements.
Frequently Asked Questions (FAQs)
How much do these optimization techniques actually improve performance?
The impact varies widely based on your specific data sources and report complexity. Data transformation optimizations typically yield the biggest improvements, often reducing load times by 50-80% for complex reports. Rendering optimizations might save 10-30% of load time, while editor experience tricks mainly improve your workflow rather than the final report performance.
I've applied all these techniques, but my report is still slow. What else can I do?
If you've optimized transformation, rendering, and your data retrieval method (covered in the first part of this series) and still experience slow performance, consider:
Breaking your report into multiple, more focused reports
Implementing a "summary-to-detail" approach where users start with high-level metrics and can drill down as needed
Evaluating if Looker (the enterprise platform) might be better suited for your needs than Looker Studio
How can I identify which specific charts or components are causing performance issues?
Unfortunately, Looker Studio doesn't offer built-in performance profiling tools. However, you can use a process of elimination:
Duplicate your report
Remove half the components
Test performance
Continue narrowing down until you identify the problematic elements
For BigQuery data sources, click the "Diagnose query performance" link in the chart header to see detailed query statistics.
Are there any browser-specific optimizations I should consider?
Chrome generally provides the best performance for Looker Studio. Ensure you're using an updated browser version and consider:
Closing unnecessary tabs to free up memory
Using a separate browser profile for Looker Studio work
For very large reports, try increasing your system's virtual memory/swap space
Optimizing Looker Studio reports is both a science and an art. The science comes from understanding the technical factors that impact performance. The art comes from making the right trade-offs between speed, functionality, and visual impact.
Remember that the perfect report isn't necessarily the one with the most features or the flashiest visualizations. It's the one that delivers actionable insights quickly and reliably. By applying the strategies we've covered to reduce transformation time, minimize rendering load, and improve your editing experience, you'll create reports that not only look professional but perform professionally too.
The best performance optimization isn't a one-time fix but an ongoing mindset. As your data grows and your reporting needs evolve, regularly revisit these principles to ensure your dashboards continue to deliver insights at the speed your organization needs.
Note:
This post is based on a subject covered in the Looker Studio Masterclass Program. To learn more about Looker Studio Masterclass, click here.