
How to Fix Slow Looker Studio Reports: The Ultimate Guide to Data Retrieval Optimization
Have you ever waited anxiously as your Looker Studio report struggled to load? You're not alone. Even expertly designed reports can crawl to a frustrating halt when they're battling with data retrieval bottlenecks.
In this guide, we'll tackle one of the most critical aspects of Looker Studio performance, optimizing how your reports fetch and process data. While most users focus solely on visual elements, the real performance magic happens behind the scenes, where your report connects to and pulls information from your data sources.
Today, we'll explore three powerful strategies that can transform your reports from sluggish to lightning-fast:
Reducing data retrieval time through smart connector choices
Minimizing the amount of data being queried in the first place
Creating your own optimized data warehouse for maximum speed
Let's dive in and unlock the full potential of your Looker Studio reports!
Why Data Retrieval Matters: The Performance Bottleneck
Before we jump into solutions, it's important to understand that data retrieval is often the single biggest bottleneck in your report's performance pipeline. When you click on a Looker Studio report link, each chart triggers a complex sequence of events:
The chart initiates a request to its data source
The data source passes credentials and parameters to the data connector
The connector sends API queries to the underlying platform
Looker Studio waits for the response
Data is transformed, aggregated, and finally rendered
Of these steps, the waiting period for API responses typically consumes the most time. This is the phase when Looker Studio has sent its request but must wait for external systems (like Google Analytics or Facebook) to process and return the data.
Now let's explore how to optimize this critical part of the process.
Strategy 1: Reducing Data Retrieval Time
When direct connections to APIs are slow, warehouse connectors can be your secret weapon.
Understanding Warehouse vs. Live Connectors
Looker Studio connectors generally fall into two categories:
Live Connectors: These connect directly to the source API in real-time (e.g., native Google Analytics 4, Google Ads connectors)
Warehouse Connectors: These pre-extract and store data in optimized databases (e.g., Supermetrics, Funnel.io, Data Studio)
Live connectors give you the freshest data but are subject to API performance limitations. Warehouse connectors sacrifice some freshness for dramatically improved speed.
When to Use Warehouse Connectors
Consider switching to a warehouse connector when:
Your reports consistently load slowly despite other optimizations
You need to query large volumes of data
Users value speed over absolutely real-time data
You're connecting to notoriously slow APIs
Popular warehouse connector options include:
Supermetrics: Excellent for marketing data sources
Funnel.io: Specializes in e-commerce and marketing data
Data Studio: Offers broad platform support
Power My Analytics: Good for Google and social media platforms
The Data Freshness Trade-off
The primary drawback of warehouse connectors is data freshness. Most extract data at scheduled intervals (hourly, daily, etc.), meaning your reports won't reflect changes that occurred since the last extraction.
Before implementing a warehouse connector, have an honest conversation with stakeholders about their true data freshness needs:
Does the marketing team really need real-time data, or is "updated daily" sufficient?
For financial reporting, is end-of-day data acceptable?
How would users feel about a report that loads in 2 seconds but is 6 hours behind versus one that loads in 20 seconds but is current?
Strategy 2: Minimizing the Amount of Data Being Queried
Sometimes the smartest approach isn't changing how you get data, it's being more selective about what data you request in the first place.
The "Less is More" Approach to Tables
Tables are often the biggest culprits when it comes to excessive data queries. Consider this scenario:
Your table displays 10 rows at a time, but behind the scenes, it's loading 500 rows and all their associated metrics. Even though users only see 10 rows, Looker Studio is processing and rendering all 500 and your report's performance suffers accordingly.
The solution? Configure your tables to query only what's visible:
In your table properties, find the "Rows per page" setting
Set it to match the number of rows actually displayed on screen (often 10-20)
Enable pagination controls so users can request more data if needed
When users click to the next page, Looker Studio will make a new, small query for just those additional rows, much more efficient than loading everything at once.
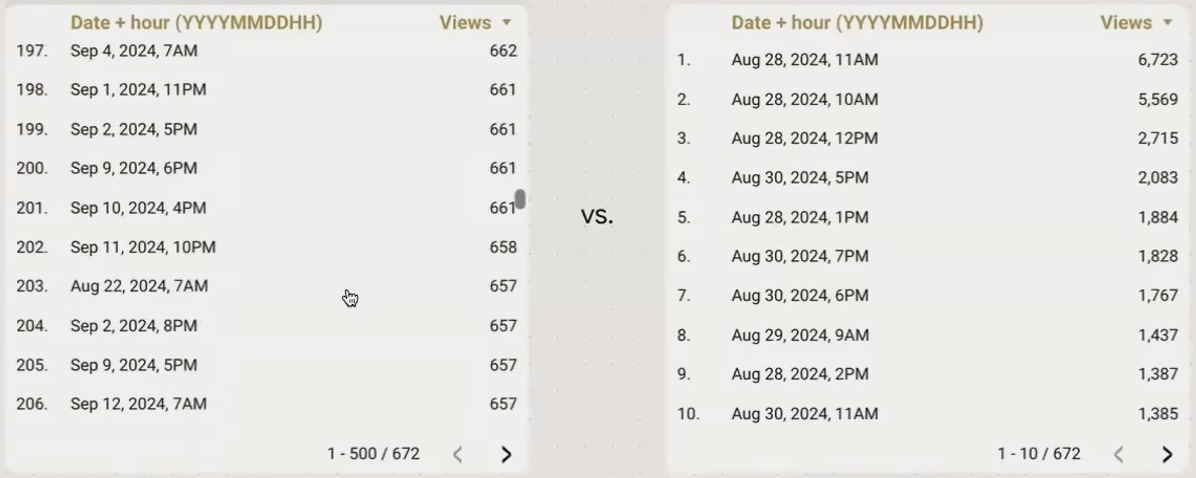
Limiting rows per page reduces the initial data load dramatically while still giving users access to all their data through pagination.
he Importance of Date Range Restrictions
Another common mistake is querying unnecessary historical data. By default, some connectors (like Google Sheets) try to pull all available data when no date restriction is specified.
To prevent this:
Always include a sensible default date range in your report
For historical analysis, create separate report pages with pre-set date ranges rather than letting users query unlimited time periods
Use date range controls with appropriate bounds to prevent users from accidentally requesting excessive data spans
Strategy 3: Creating Your Own Data Warehouse
For the ultimate control over performance, nothing beats creating your own optimized data warehouse. This approach gives you the best of both worlds: fast access and customized data preparation.
The BigQuery Advantage
Google BigQuery is the preferred data warehouse solution for Looker Studio power users, and for good reason:
Native Integration: Looker Studio and BigQuery are both Google products with seamless connectivity
Incredible Speed: BigQuery is designed specifically for analytical queries
BI Engine: An in-memory analysis service that dramatically accelerates queries
Cost-Effective: Pay only for the queries and storage you use
With BigQuery as your data warehouse, you can:
Extract data from source systems on a schedule
Transform and prepare data exactly as needed
Create optimized tables specifically for reporting
Connect Looker Studio to these pre-built tables
For example, instead of having Looker Studio query the Google Analytics API directly, you can use the GA4 BigQuery Export to load your analytics data into BigQuery nightly, then connect your reports to these tables.
Understanding BI Engine
One of BigQuery's most powerful features for Looker Studio users is BI Engine. This service keeps frequently accessed data in high-speed memory (RAM) rather than reading from disk storage each time.
The result? Sub-second query response times, even for complex reports.
Every Looker Studio user automatically gets 1GB of BI Engine capacity for free, which is sufficient for many reporting needs. For larger datasets, you can reserve additional capacity.
When using a BigQuery data source in Looker Studio, you'll know BI Engine is working when you see "Query performance accelerated by BigQuery BI Engine" in the performance diagnostics.
The "Poor Man's BigQuery": Extract Data Connector
Don't have the resources or technical expertise for a full BigQuery implementation? Looker Studio offers a fantastic alternative with the built-in Extract Data connector.
This free feature lets you:
Select any existing data source in your Looker Studio account
Choose specific fields, dimensions, and metrics you need
Apply filters and date ranges
Extract and store up to 100MB of data in Looker Studio's managed storage
Schedule daily refreshes to keep data current
Behind the scenes, Extract Data uses BigQuery and BI Engine, giving you warehouse-level performance without any of the technical setup.
Here's how to set it up:
In Looker Studio, go to "Create" > "Data Source"
Select "Extract Data" from the connector list
Choose your source data source
Select the fields you want to extract
Set a date range if applicable
Click "Save & Extract"
Once extraction is complete, you'll have a new data source that queries at lightning speed.
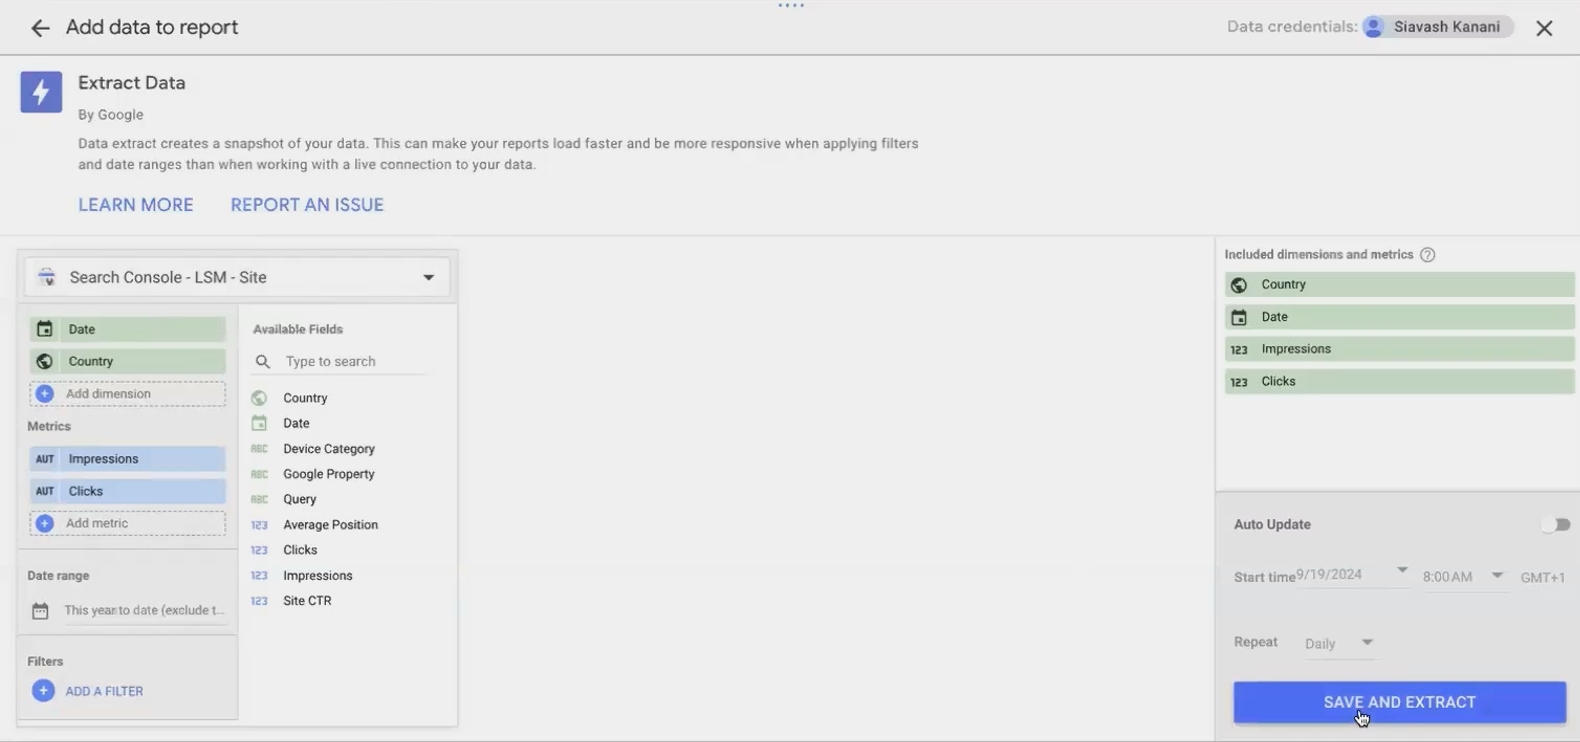
The Extract Data connector provides BigQuery-like performance without requiring you to set up or manage your own warehouse.
Limitations to Keep in Mind
While creating your own data warehouse offers tremendous performance benefits, it does come with some considerations:
Data Freshness: Your warehouse will only be as current as your last data extraction
Technical Overhead: A BigQuery implementation requires some SQL knowledge and data pipeline setup
Extract Data Limits: The Extract Data connector is limited to 100MB per extraction
Scheduling Restrictions: Extract Data refreshes can only be scheduled daily (not hourly)
For most business reporting scenarios, these limitations are acceptable trade-offs for the dramatic performance improvements you'll gain.
Putting It All Together: A Decision Framework
With three powerful strategies at your disposal, how do you decide which to implement? Consider this decision framework:
Start with query minimization - This is the easiest to implement and requires no additional tools or costs
Try Extract Data - If minimizing queries isn't enough, this gives you warehouse performance with zero technical setup
Consider third-party warehouse connectors - When you need more frequent updates than daily and don't want to manage infrastructure
Implement BigQuery - The ultimate solution for complex reporting needs with large datasets
For many organizations, a combination of these strategies works best. You might use BigQuery for your core business metrics while using Extract Data for simpler marketing reports.
Frequently Asked Questions (FAQs)
Is there any limit to the amount of data that can be cached for one dashboard?
While there isn't a documented hard limit for standard data source caching, the Extract Data connector has a firm limit of 100MB per extract. This suggests that caching is designed for reasonably sized datasets, not massive ones.
How does data volume affect load times and what thresholds should I be aware of?
Data volume dramatically affects every aspect of report performance. A good rule of thumb: if a human can't reasonably comprehend the data in a few minutes, it's probably too much. For example, plotting millions of individual addresses on a map will break your report. Instead, aggregate the data first (e.g., by ZIP code) and visualize the summary.
What caching techniques can I use to speed up reports that are requested frequently?
Set a longer data freshness period (12-24 hours) and limit the number of filter variations by using controlled dropdowns rather than free-form filters. This maximizes the chance that a user's query will match one already in the cache.
Is creating a table in BigQuery and connecting it to Looker Studio better than running a query every time?
Absolutely! Connecting to a pre-built table is significantly faster than connecting to a view or executing a query. For optimal performance, schedule queries to refresh your tables at appropriate intervals (daily, hourly, etc.) based on your data freshness requirements.
When refreshing my browser to improve editor performance, is F5 enough or do I need a hard refresh?
A standard refresh (F5 or Command+R) is usually sufficient to clear the undo/redo history that can slow down the editor. For more persistent issues, try a hard refresh (Ctrl+F5 or Command+Shift+R).
Optimizing data retrieval in Looker Studio isn't about applying a single trick—it's about developing a strategy that balances speed, data freshness, and user needs. By understanding the options available for reducing retrieval time, minimizing query volume, and creating optimized data warehouses, you can build reports that not only look great but perform exceptionally well.
Remember, the fastest and most beautiful report in the world is useless if users abandon it while waiting for it to load. Make performance optimization a central part of your Looker Studio development process, and your users will thank you with their continued engagement and trust in your data.
Note:
This post is based on a subject covered in the Looker Studio Masterclass Program. To learn more about Looker Studio Masterclass, click here.