
Mastering Data Blending in Looker Studio: From Left Joins to Calculated Fields
Welcome to the fascinating world of data blending in Looker Studio! If you've ever found yourself frustrated trying to combine metrics from different sources into a single visualization, you're about to discover the solution. This month, we're diving deep into data blending – a powerful feature that, when mastered, will put you ahead of 99.9% of Looker Studio users.
In this lesson, we'll build a solid foundation by covering:
The simple blend approach for quick metric combinations
Left joins – the workhorses of data blending
How to create powerful calculated fields in your blended data
Let's transform how you work with data in Looker Studio!
The "Simple Blend" - A Quick Shortcut for Metric Combinations
Now let's look at the simplest form of data blending: combining two standalone metrics, often displayed in scorecards.
This "simple blend" approach is perfect when you need to:
Combine metrics from different data sources into a single calculated metric
Compare the same metric with different filters
Compare the same metric across different time periods
How to Create a Simple Blend
Select the first component (e.g., a scorecard showing GA4 Sessions)
Hold Ctrl/Cmd and select the second component (e.g., a scorecard showing CRM Sales)
Right-click and select "Blend data"
Looker Studio will create a new blended data source and a new scorecard, often attempting to create a ratio between the two metrics automatically.
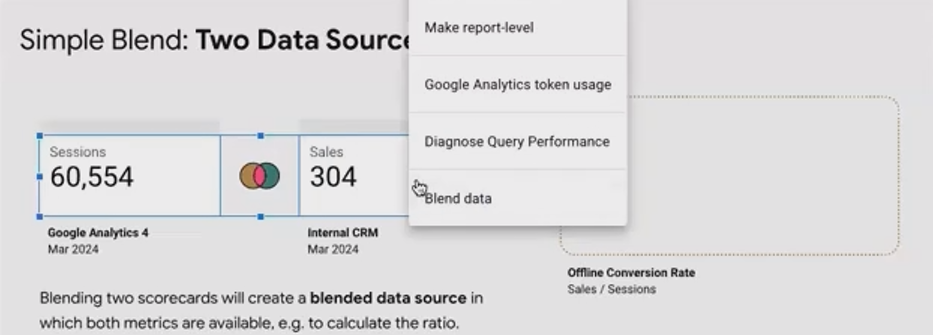
Caption: The simple blend approach lets you quickly combine metrics from separate scorecards into a new calculation.
Important Note on Simple Blends
Under the hood, simple blends typically use a cross join rather than a left join. This works well for these specific metric-only blends without needing to specify join keys, but it's important to know this differs from the standard left join we discussed earlier.
Example: Comparing Add to Cart to View Item Events
A common e-commerce analysis requires calculating the Add to Cart rate (the percentage of product views that result in adds to cart). Here's how to use a simple blend for this:
Create a scorecard showing Event Count filtered for 'event_name = view_item'
Create another scorecard showing Event Count filtered for 'event_name = add_to_cart'
Blend these scorecards together
Edit the blend to rename the generic "Event Count" fields to "View Items" and "Add to Carts" for clarity
Format the resulting scorecard as a percentage
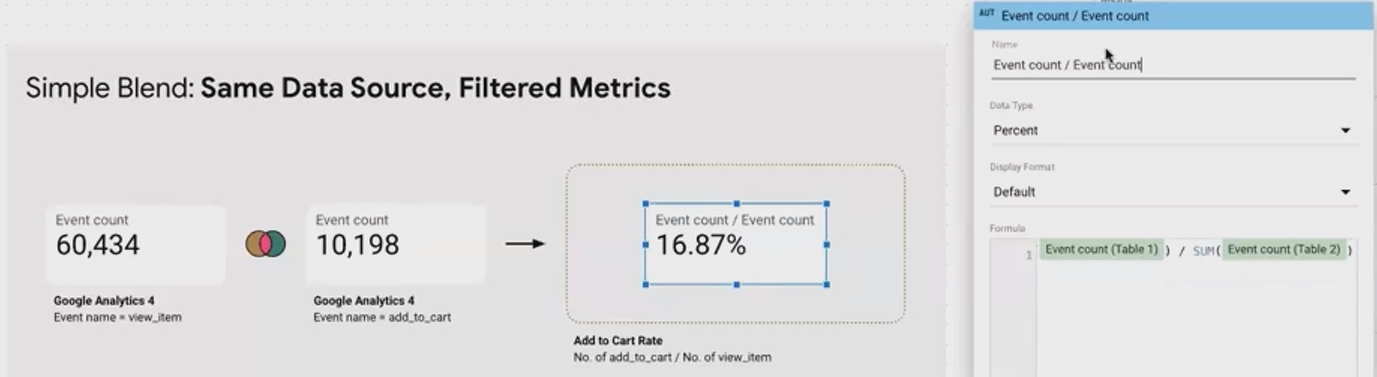
Pro Tip: Always rename your metrics within the blend to avoid confusion. Generic names like "Event Count" and "Event Count (2)" make your calculations difficult to understand.
Example: Comparing Revenue Across Time Periods
Another useful application is comparing metrics across different time periods:
Create a scorecard showing Purchase Revenue with a custom date range (January 2024)
Create another scorecard showing Purchase Revenue with a different date range (February 2024)
Blend these scorecards
Format the result as a percentage for year-over-year growth or as currency for absolute difference
Important: Always verify that your custom date ranges carry over correctly into the blend. This is a common source of errors in simple blends.
Calculated Fields in Blended Data Sources
Once you've successfully blended data, you can create powerful calculated fields using dimensions and metrics from all your source tables.
For example, if you've blended:
Google Ads data (Date, Impressions, Cost)
Offline Sales data (Date, Sales)
You can now create calculations like Cost per Sale (Cost ÷ Sales) that weren't possible when these metrics lived in separate data sources.
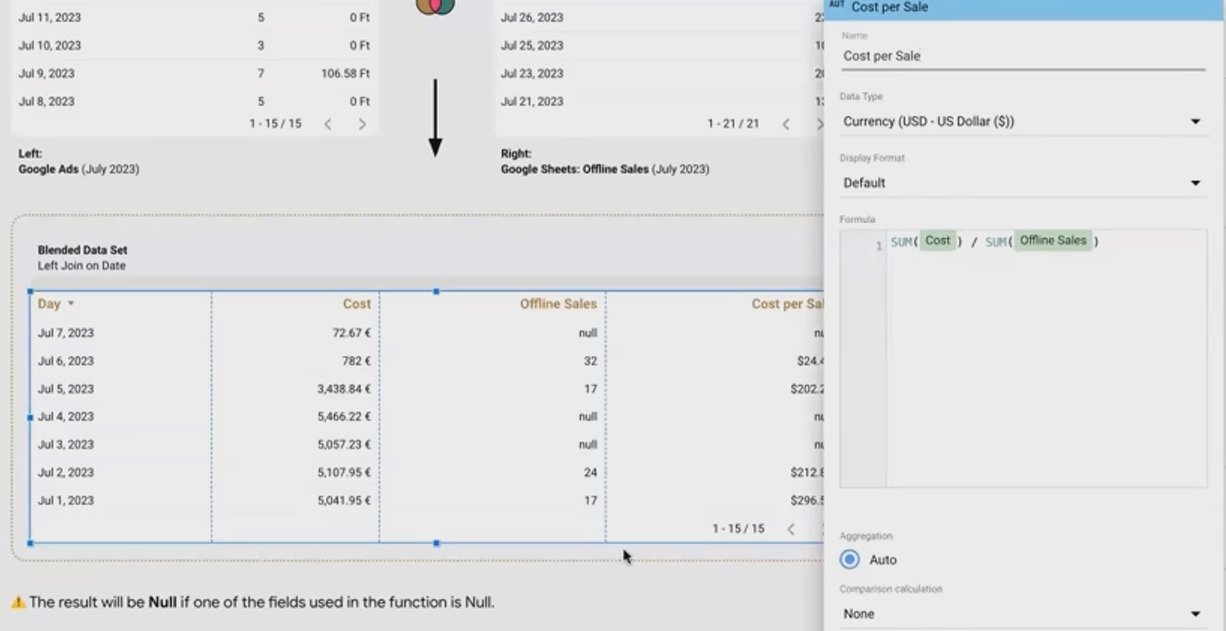
The Challenge of Nulls in Calculations
A critical issue when working with blended data is handling null values. When any component of a calculated field is null, the entire calculation will return null.
For instance, if 'Offline Sales' is null for certain dates, your 'Cost per Sale' calculation will also be null for those dates, even if you had costs.
Two Approaches to Handling Nulls
1. Display Settings (Cosmetic Only)
In your chart or table settings, you can choose how nulls are displayed:
Show as "0"
Show as "-"
Show as "No Data"
Show as blank
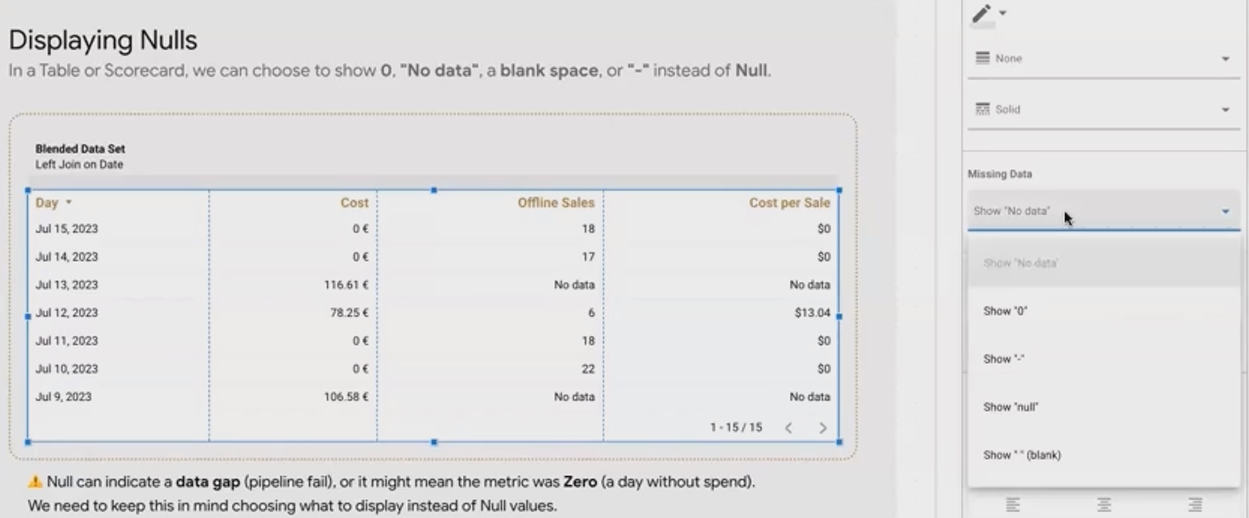
Important: This only changes how nulls appear visually. The underlying value remains null for calculations.
Warning: Be cautious about setting nulls to display as "0" by default. While it might make your charts look cleaner, it can mask actual data pipeline issues or legitimately missing data.
2. Null Handling Functions (For Calculations)
To properly handle nulls in calculations, use these Looker Studio functions:
IFNULL(field, value_if_null): If the field is null, returns the specified alternative value
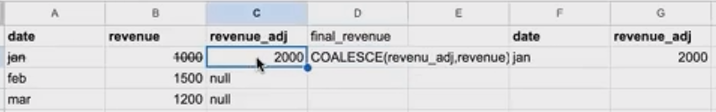
COALESCE(field1, field2, ..., fallback): Returns the first non-null value from the list
COALESCE(Adjusted_Revenue, Original_Revenue, 0)Example: Fixing "Cost per Sale" with Null Handling
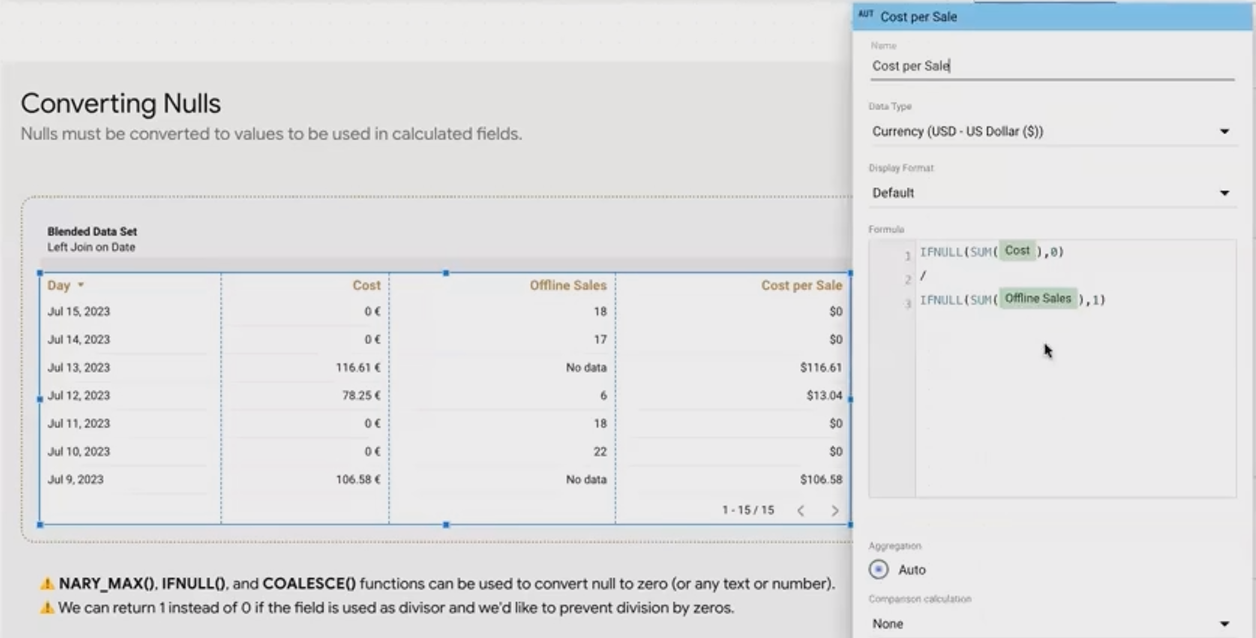
Let's say you want to calculate Cost per Sale, but some days have no sales (nulls):
Original formula (problematic):
SUM(Cost) / SUM(Offline_Sales)Improved formula with null handling:
IFNULL(SUM(Cost), 0) / IFNULL(SUM(Offline_Sales), 1)This formula:
Treats null cost as 0 (no cost)
Treats null sales as 1 (to avoid division by zero)
The specific replacement values should reflect your business logic. For example, if days with cost but no sales should show the full cost (treating it as "cost per 1 sale"), use 1 as the replacement. If you want to exclude these days completely, your approach would be different.
Frequently Asked Questions (FAQs)
How can I use data blending to show adjusted data for a specific time period while letting current data update normally?
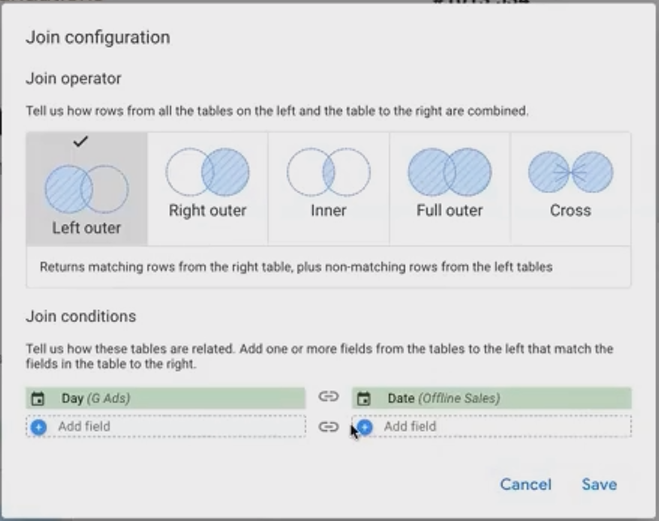
This is a perfect use case for a left join. Create a blend where:
Your main data source is the left table (contains all your regular data)
A Google Sheet with your adjusted figures is the right table (only include rows that need adjustment)
Join on Date
Create a calculated field:
COALESCE(Adjusted_Value, Original_Value)
This will use the adjusted value when available and fall back to the original value for all other dates.
Why does the sum row in my blended table show incorrect totals?
This typically happens due to the duplicate row problem discussed earlier. When one value in your left table matches multiple values in your right table, metrics from the left table get duplicated, leading to inflated sums.
Solutions include:
Pre-aggregate your right table to ensure one-to-one matching with your left table
Use multiple join keys to create more specific matches
Use calculated fields with appropriate aggregation functions to compensate for the duplication
Can I reuse a blended data source across multiple reports?
No, blended data sources are embedded within the report where they're created. If you copy a report, the blend will be copied with it, but as a separate entity. There's no way to create a centralized, reusable blend across different reports.
We've covered the foundational concepts of data blending in Looker Studio, focusing on:
What data blending is and when to use it
How left joins work and their potential pitfalls
Simple blends for quick metric combinations
Creating and troubleshooting calculated fields in blends
Data blending unlocks powerful reporting capabilities that simply aren't possible with single-source visualizations. While it requires some careful thought about how your data should merge, the payoff is richer, more insightful reports that answer your most complex business questions.
Remember that data blending in Looker Studio is fundamentally SQL joins with a user-friendly interface. Keeping this in mind will help you troubleshoot unexpected results and design your blends more effectively.
Now that you understand the foundations, you're ready to start creating more sophisticated reports that seamlessly combine data from multiple sources!
Note:
This post is based on a subject covered in the Looker Studio Masterclass Program. To learn more about Looker Studio Masterclass, click here.