
Looker Studio Data Blending: A Beginner's Guide to Merging Data
Welcome to the world of data blending in Looker Studio! If you've ever struggled with connecting multiple data sources to a single chart or wanted to create calculations using metrics from different platforms, you're about to discover one of Looker Studio's most powerful features.
Data blending is often what separates beginner Looker Studio users from those who can create truly insightful, comprehensive dashboards. Yet it's also one of the most misunderstood features, leading to frustrating errors and unexpected results. By the end of this guide, you'll understand data blending at a deeper level than 99% of Looker Studio users, saving yourself countless hours of troubleshooting in the future.
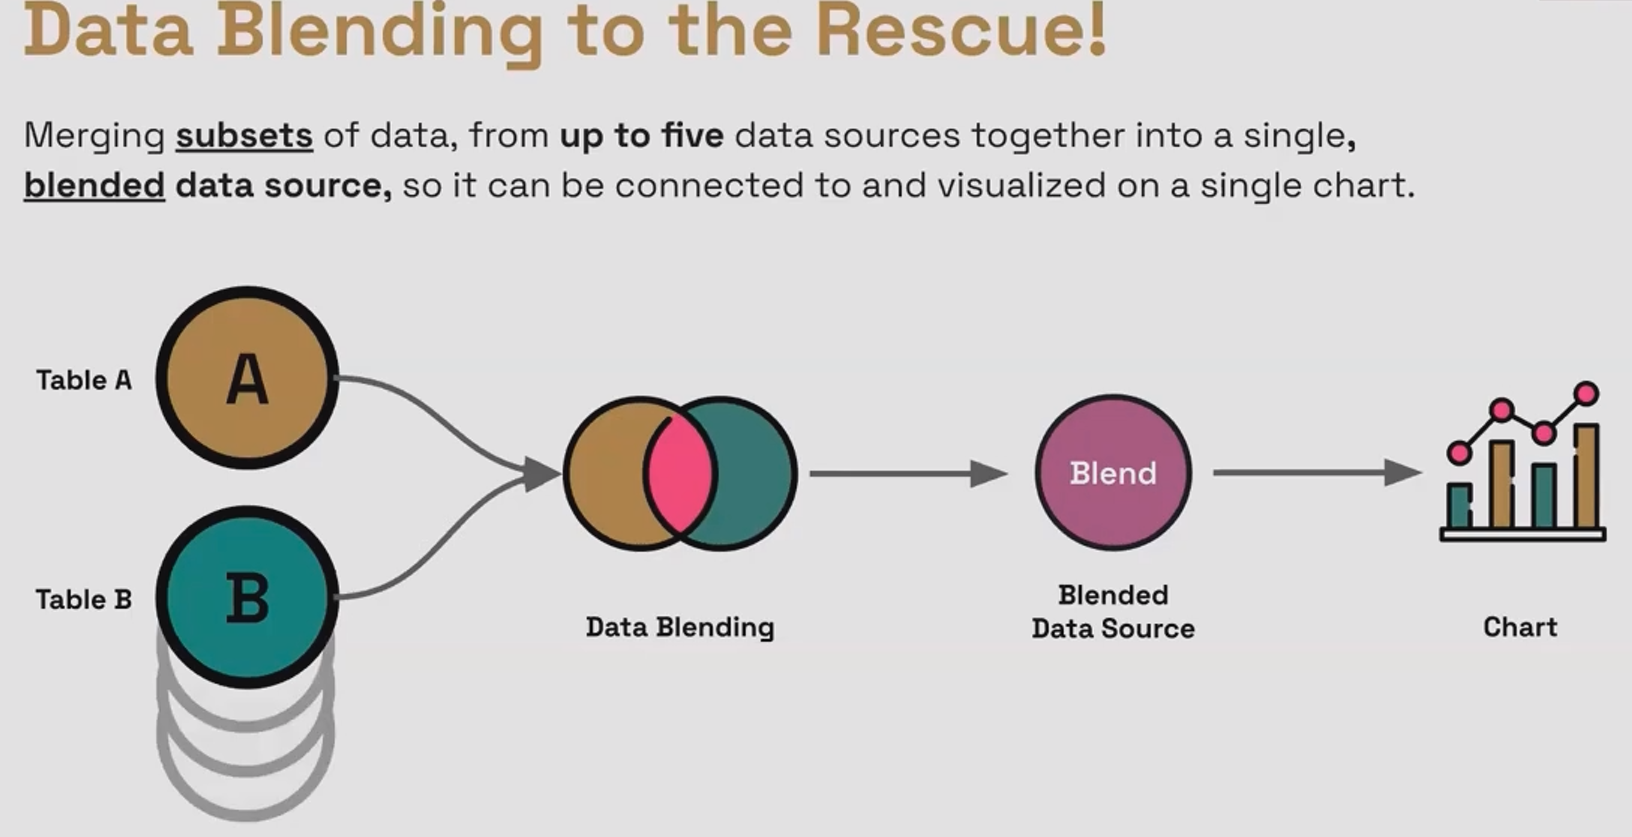
The data blending interface in Looker Studio allows you to combine up to five data sources into one unified dataset.
What is Data Blending and Why Does It Matter?
At its core, data blending in Looker Studio allows you to merge data from multiple data sources (up to five) into a single, unified dataset. Think of it as creating a "super table" that pulls specific fields from different sources and combines them based on rules you define.
But why is this important? Consider these common scenarios:
You need to show total marketing spend across Google Ads, Meta, and LinkedIn in a single scorecard
You want to calculate Cost Per Acquisition where 'cost' lives in your ad platform and 'acquisitions' live in Google Analytics
You need to enrich your e-commerce data by adding product margin information from an internal database
Without data blending, you'd be stuck creating separate charts for each data source or performing manual calculations outside of Looker Studio. With blending, you can create seamless, powerful visualizations that tell a complete story.
The Golden Rule to Remember: Every chart in Looker Studio can only connect to ONE data source. Data blending doesn't break this rule – instead, it creates a new, blended data source that your chart can connect to.
Behind the Curtain: How Data Blending Actually Works
Here's the secret that even many experienced Looker Studio users don't realize: data blending is essentially performing SQL joins without writing SQL code.
Yes, that's right. When you blend data in Looker Studio, you're using a user-friendly interface that's generating SQL join operations behind the scenes. This is critical knowledge because understanding the basic principles of SQL joins will help you troubleshoot and optimize your blends.
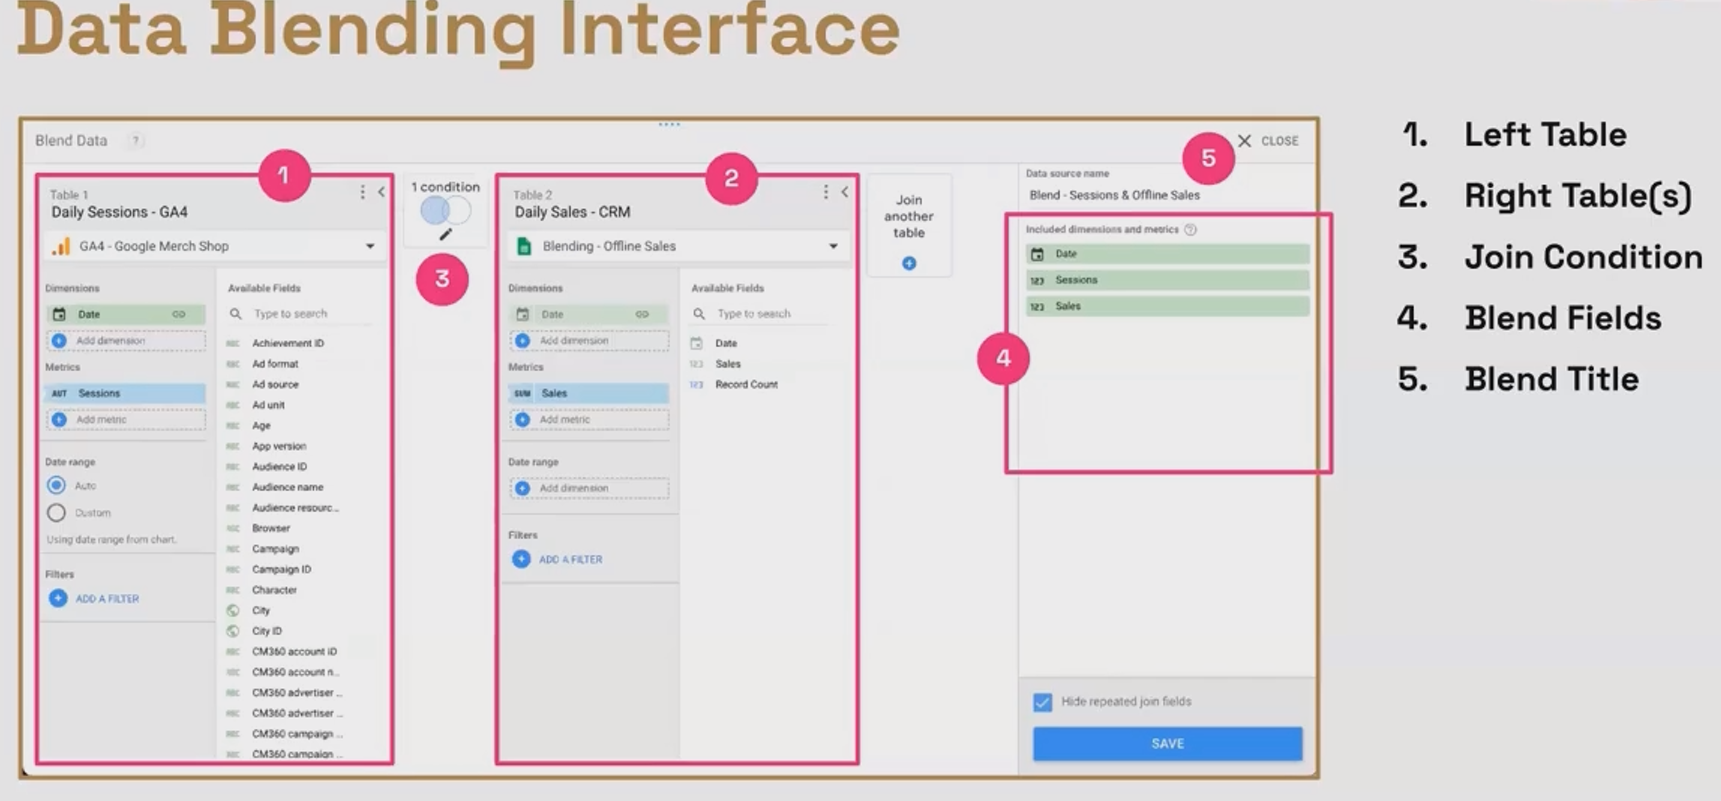
In a typical blend, you'll work with:
Left Table: Your primary data source
Right Table(s): Up to four additional data sources
Join Conditions: The rules for how records should match between tables
Join Operator: The type of join (Left, Inner, etc.)
Join Key(s): The common field(s) used to match rows
The most common join type in Looker Studio is the Left Join (also called Left Outer Join), which we'll explore in detail shortly.
Key Properties of Blended Data Sources
Before diving deeper, let's understand some important characteristics of blended data sources:
They're embedded within your report – Unlike regular data sources, blended data sources cannot be shared or reused across different reports. If you copy a report, the blend comes with it, but as a new, independent blend.
They behave like regular data sources – Once created, a blended data source has dimensions and metrics that can be used in charts just like any other data source.
They can un-aggregate metrics – This is an advanced property we'll explore in future blogs, but blends can sometimes help you work with metrics at a more granular level.
Mastering the Left Join: The Backbone of Data Blending
The left join is the most common and versatile join type in Looker Studio blends. Understanding it thoroughly will solve most of your data blending needs.
A left join works by:
Taking ALL records from your left table
Adding matching records from your right table
Where no match exists, the fields from the right table show as null
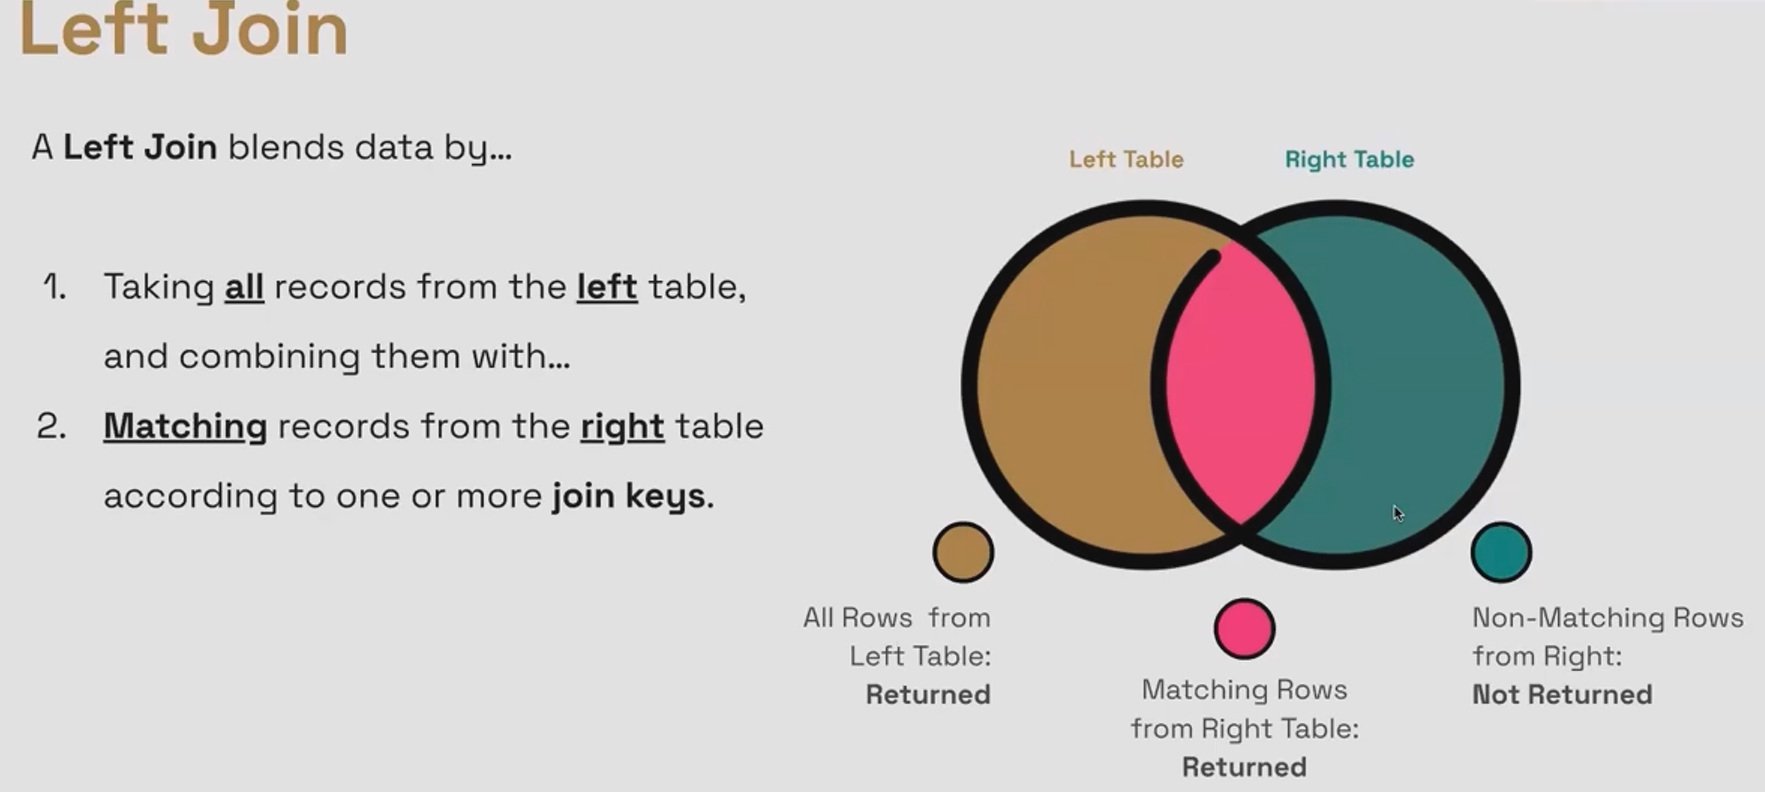
A left join keeps everything from the left table and only the matching parts of the right table.
The key concept to grasp: Left joins are about enriching your left table with additional data.
Think of left joins as "looking up properties of something" or "translating something." For example:
Looking up the population of a city
Finding a customer's email address based on their ID
Translating a product SKU to its friendly name
Adding margin data to product revenue
In each case, the "something" is your join key – the common field that exists in both tables that Looker Studio uses to match records.
The Critical Detail: Join Keys Must Match EXACTLY
If your blend isn't returning the data you expect, the most common culprit is mismatched join keys. For a join to work, the values must be identical, including:
Case sensitivity (e.g., "ABC" ≠ "abc")
Spaces (trailing or leading spaces matter)
Formatting (e.g., dates in different formats won't match)
Let's see a simple example of a left join:
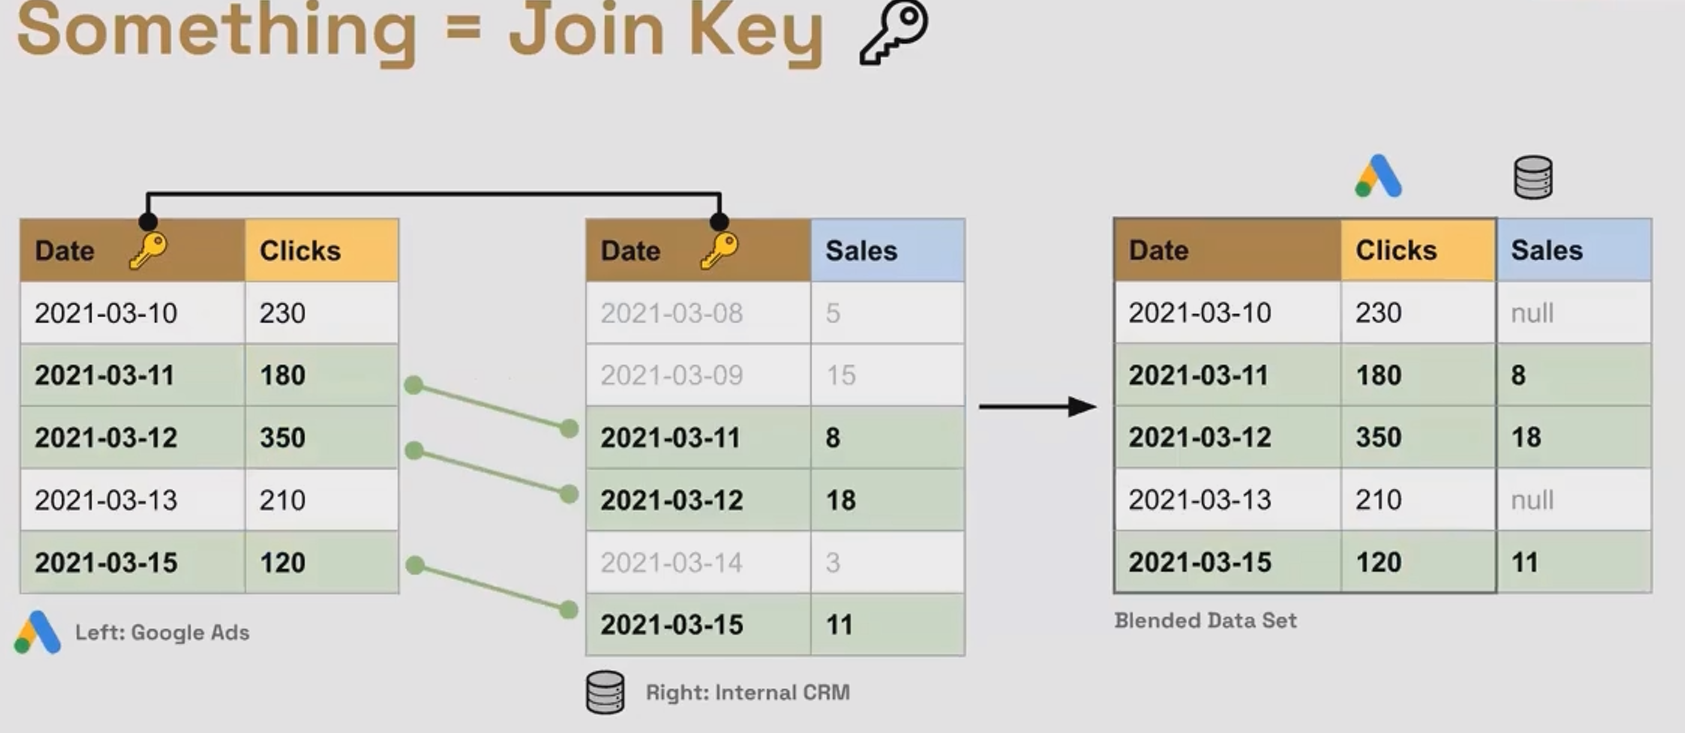
Notice that:
All rows from the left table (Google Ads) are preserved
Offline Sales data is added where the dates match
For 2021-03-10, where no matching sales data exists, we see null
The 2023-03-08 row from the right table isn't included at all (as it has no matching left table record)
The Row Duplication Problem: A Common Gotcha
One of the most confusing aspects of data blending occurs when your blend returns more rows than you expected. This happens when one record in your left table matches multiple records in your right table.
For example, if your left table has daily data, but your right table has daily data broken down by product, each day in your left table might match multiple products in your right table. Looker Studio will duplicate the left table's rows to accommodate all matches, potentially inflating your metrics.
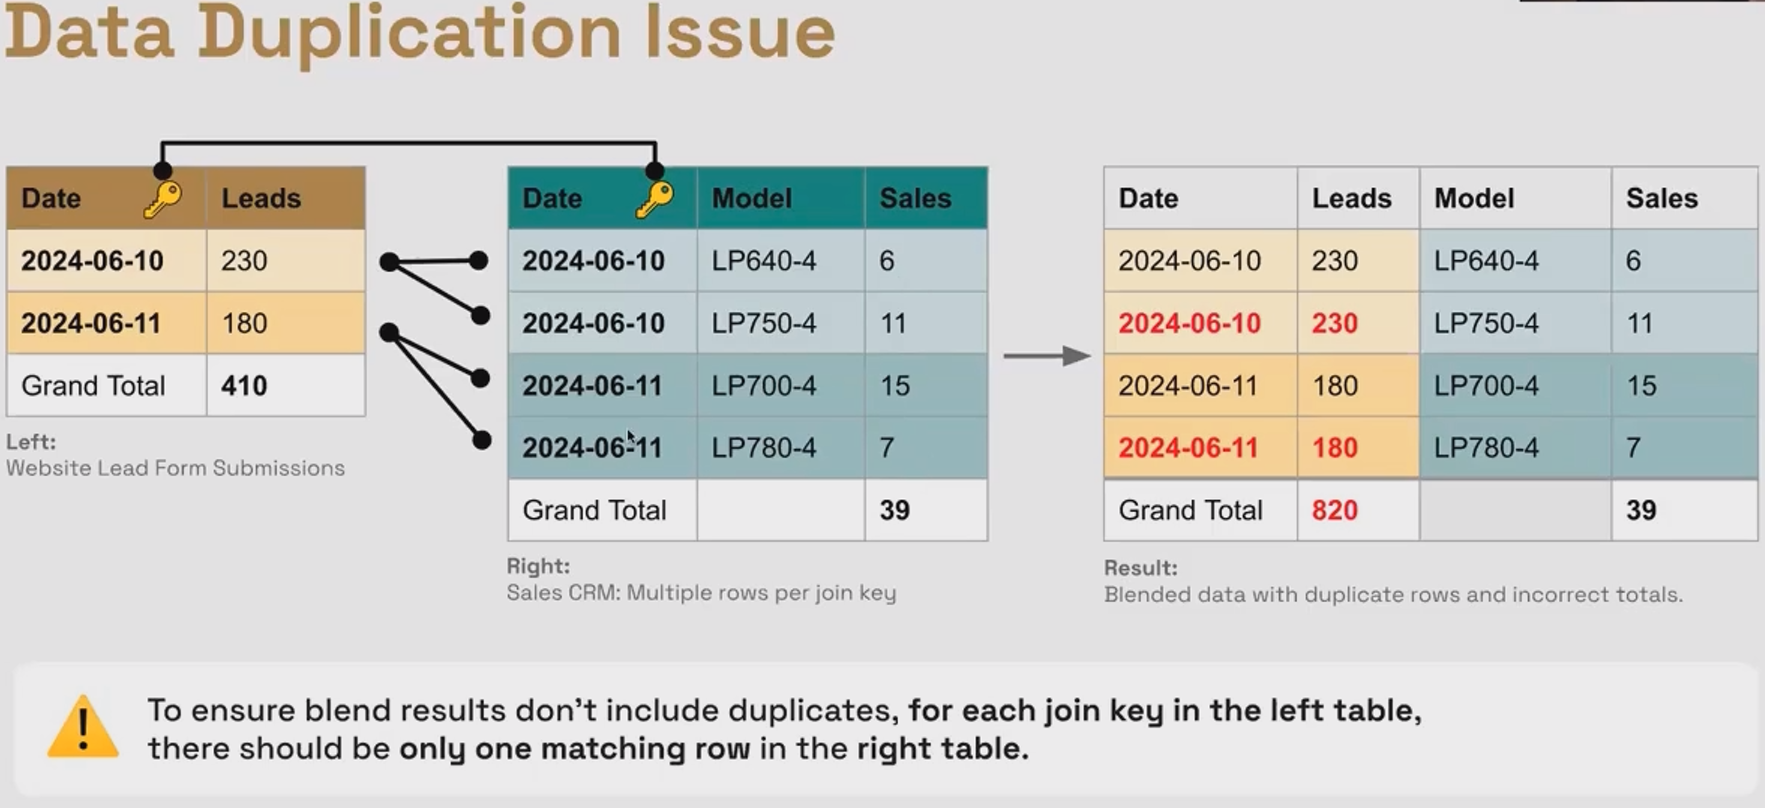
The problem? If you sum the Leads column, you'll get 820 (230+230+180+180) instead of the correct 410 (230+180).
Solutions to this problem:
Aggregate your right table before blending to ensure one record per join key value
Break down your left table to match the granularity of your right table
Use multiple join keys (e.g., join on both Date AND Product Model) if you have the necessary dimensions in both tables
The Simple Blend: A Quick Shortcut for Metric Mashups
For certain scenarios, Looker Studio offers a faster way to blend data, which I call the "Simple Blend." This works particularly well when you just need to combine metrics from different data sources, especially for scorecards.
Here's how it works:
Select a component (like a scorecard) showing a metric from one data source
Hold Ctrl/Cmd and select another component with a metric from another data source
Right-click and select "Blend data"
Looker Studio will create a new blended data source and automatically place the result in a new component. This is perfect for quickly creating ratios or combinations of metrics, such as:
Sales divided by Sessions
Add to Cart Rate (Add to Carts / View Items)
Month-over-month comparison (January Revenue vs. February Revenue)
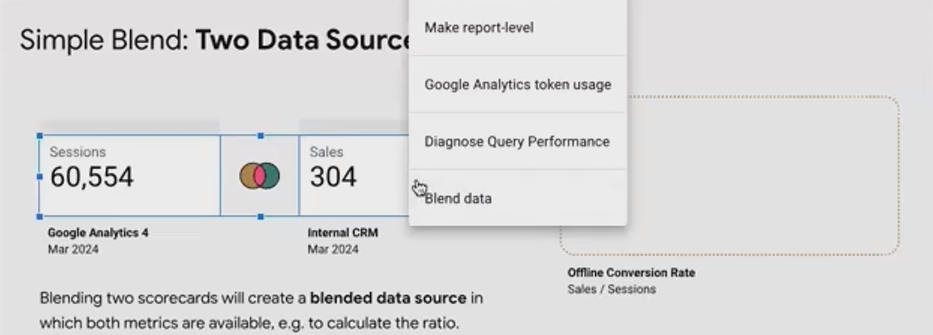
A simple blend lets you quickly combine metrics from different data sources without manually configuring the blend.
Pro Tip: When blending two metrics with the same name (e.g., "Event Count" filtered differently), make sure to rename them within the blend configuration for clarity.
Handling Nulls in Calculated Fields
When you blend data, you'll often encounter null values where no matching record exists in the right table. This becomes problematic when creating calculated fields, as nulls in any component of a formula will result in a null output.
For example, if you're calculating Cost per Sale (Cost / Offline Sales) and some days have null for Offline Sales, your calculation will show null for those days.
There are two aspects to handling nulls:
Display settings: In chart settings, you can control how nulls appear visually (as "0", "-", "No data", etc.)
Calculation handling: Using functions to replace nulls with actual values in your formulas
For calculations, Looker Studio provides these helpful functions:
IFNULL(field, value_if_null): If the field is null, return the specified value
COALESCE(field1, field2, ..., fallback): Return the first non-null value from the list of fields
Here's how to fix our Cost per Sale calculation:
IFNULL(SUM(Cost), 0) / IFNULL(SUM(Offline Sales), 1)This formula:
Replaces null Cost with 0 (assuming no cost if null)
Replaces null Offline Sales with 1 (to avoid division by zero errors)
The result is a calculation that works even when data is missing from either source.
Frequently Asked Questions (FAQs)
How can I use data blending to show adjusted data for a specific past period while allowing current data to update normally?
This is a perfect use case for data blending! You can:
Create a left join with your main data source (containing all dates) as the left table
Use a Google Sheet with your adjusted figures (only for dates needing correction) as the right table
Join on Date
Create a calculated field using
COALESCE(Adjusted_Value, Original_Value)
This will use the adjusted value when available, but fall back to the original value for all other dates.
Why does the sum row in my blended table show incorrect totals?
This typically happens due to the row duplication problem discussed earlier. If one record in your left table matches multiple records in your right table, metrics from the left table will be repeated, inflating your sums.
Check your join structure and consider:
Aggregating your right table before blending
Using more specific join keys
Pre-aggregating your data in a calculated field that accounts for the duplication
How does data blending work with cross-filtering?
Data blending and cross-filtering can work together, but there are some nuances to understand. Generally, when you apply a cross-filter to a chart using a blended data source, the filter will apply to the underlying data sources based on the dimensions that exist in those sources. This is a more advanced topic that requires careful consideration of your specific blend structure.
Data blending is truly what separates basic Looker Studio dashboards from sophisticated analytical tools. While we've covered the foundations in this lesson, we've only scratched the surface of what's possible.
With the left join principles you've learned today, you can already solve many common data challenges:
Combining metrics from different marketing platforms
Adding contextual data to your analytics
Creating powerful cross-source calculations
Translating technical IDs into human-readable information
As you practice these techniques, you'll find yourself creating more insightful, comprehensive dashboards that tell the complete story of your data.
Ready to take your Looker Studio skills to the next level? Start experimenting with data blending today using the examples we've covered, and watch your reporting capabilities transform.
Note:
This post is based on a subject covered in the Looker Studio Masterclass Program. To learn more about Looker Studio Masterclass, click here.