
Using templr.pro to Customize Your Looker Studio Reports
Looking to take your Looker Studio reports to the next level? While Looker Studio offers a robust set of native visualizations, there are times when you need something more tailored to your specific reporting needs. This is where templr.pro comes in, a game-changing tool that allows you to create custom visualizations without extensive coding knowledge.
In this article, we'll explore how templr.pro is revolutionizing the way we build custom visualizations in Looker Studio, with practical examples that you can implement today.

What is templr.pro?
Templr.pro emerged from a common frustration among Looker Studio users: creating custom visualizations with Google's Community Visualization SDK was too complex and time-consuming. The process required:
An experienced front-end developer
Advanced knowledge of JavaScript
Familiarity with visualization libraries like D3.js, Chart.js, or Vue.js
Understanding of Google Cloud Storage
Knowledge of Node Package Manager (NPM)
A tedious development cycle with constant uploading to Google Cloud
The team at Siavak (led by Siavash Kanani) recognized this problem and developed templr.pro as a solution. Put simply, templr.pro is a community visualization that allows you to create other visualizations using basic HTML, CSS, and minimal JavaScript.
As Siavash explains: "We wanted to create a community visualization that helps create lower-code community visualizations, much easier and much quicker."
How templr.pro Works
The beauty of templr.pro lies in its simplicity:
Add it to your Looker Studio report just like any other community visualization
Write HTML and CSS in the component's style panel
Access your data using a simple templating syntax
See your changes render in real-time
The templr.pro interface allows you to write HTML, CSS, and JavaScript directly in Looker Studio
The feedback is immediate, no need to upload code to a Google Cloud bucket and wait to see if it works. What previously took days can now be accomplished in minutes.
Practical Examples of templr.pro in Action
Let's explore some real-world examples of what you can build with templr.pro:
1. Google Fonts Integration
One of the most common requests from clients is to use custom fonts in Looker Studio reports to match their brand identity. Unlike Google Slides or Sheets, Looker Studio is limited to about 20-30 default fonts.
The original Google Fonts component took 8 hours to build using the SDK. With templr.pro:
Two lines of HTML
Four lines of CSS
Time to build: 5 minutes
<span class="g-font">Your custom text here</span>.g-font {
font-family: 'Space Mono', monospace;
font-size: 24px;
color: #333;
}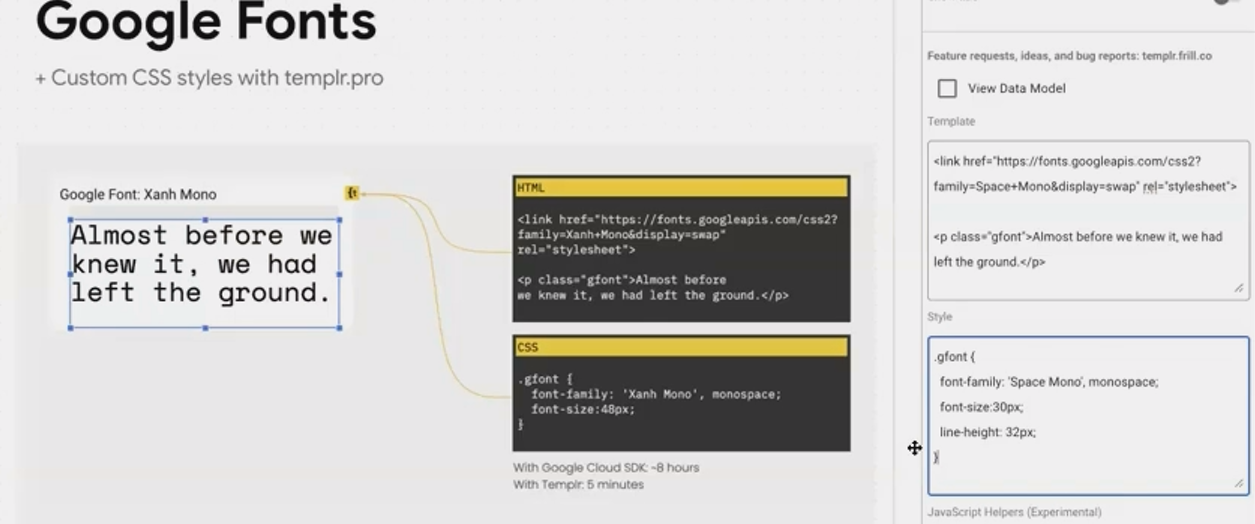
Simply change the font name to access any of the thousands of fonts in the Google Fonts library, perfect for creating on-brand reports in any language.
2. Animated Text Effects
Want to add some visual flair to your reports? With templr.pro, you can implement CSS animations that would be impossible with standard Looker Studio components.

By adapting free code from CodePen and applying it to templr.pro, you can create engaging animated text effects that make your reports stand out. The HTML is minimal, while the CSS does all the heavy lifting.
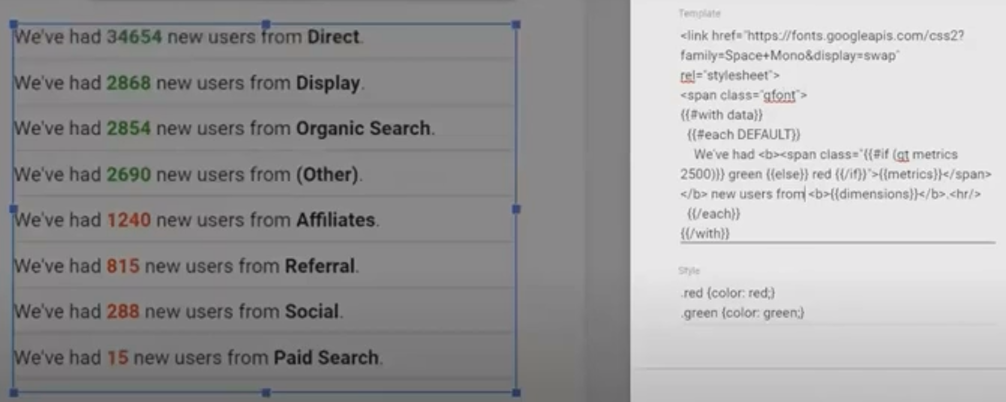
3. Conditional Content
Data visualization often requires conditional formatting, showing different content based on metric values. For example, displaying "Great!" in green when KPIs exceed targets, or "Low" in red when they fall short.
The original conditional content component took over 20 hours to build with the SDK. With templr.pro:
{{#if metrics.0.value > 40000}}
  <span class="high">Great!</span>
{{else if metrics.0.value > 25000}}
  <span class="medium">Medium</span>
{{else}}
  <span class="low">Low</span>
{{/if}}
.high { color: green; }
.medium { color: orange; }
.low { color: red; }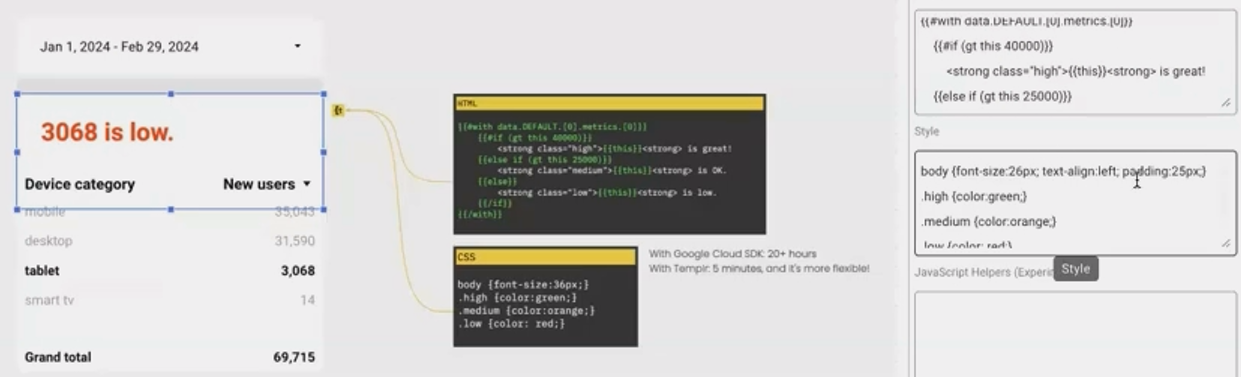
This component responds dynamically to cross-filtering and date range changes, just like native Looker Studio components.
4. Interactive Tooltips
Tooltips provide contextual information without cluttering your dashboard, but they weren't universally available in Looker Studio until recently (and even now, only in certain contexts for Looker Studio Pro users).
With templr.pro, you can add tooltips anywhere in your report:
<span class="tooltip-container">?
  <span class="tooltip-text">{{fields.metrics.0.name}} is {{metrics.0.formattedValue}}</span>
</span>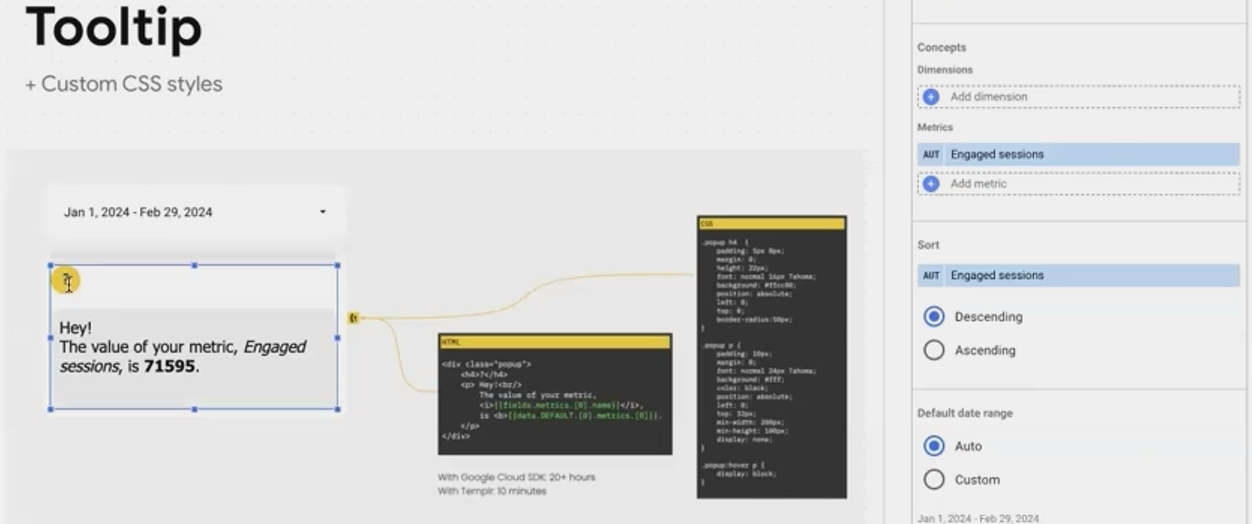
The tooltip displays both the metric name and its current value, updating automatically when filters or date ranges change.
5. Custom Styled Tables
Tables in Looker Studio have limited customization options. With templr.pro, you can create tables with custom fonts, styles, and dynamic headers:
<h2>{{fields.metrics.0.name}} by {{fields.dimensions.0.name}}</h2>
<table class="custom-table">
  <!-- Table content here -->
</table>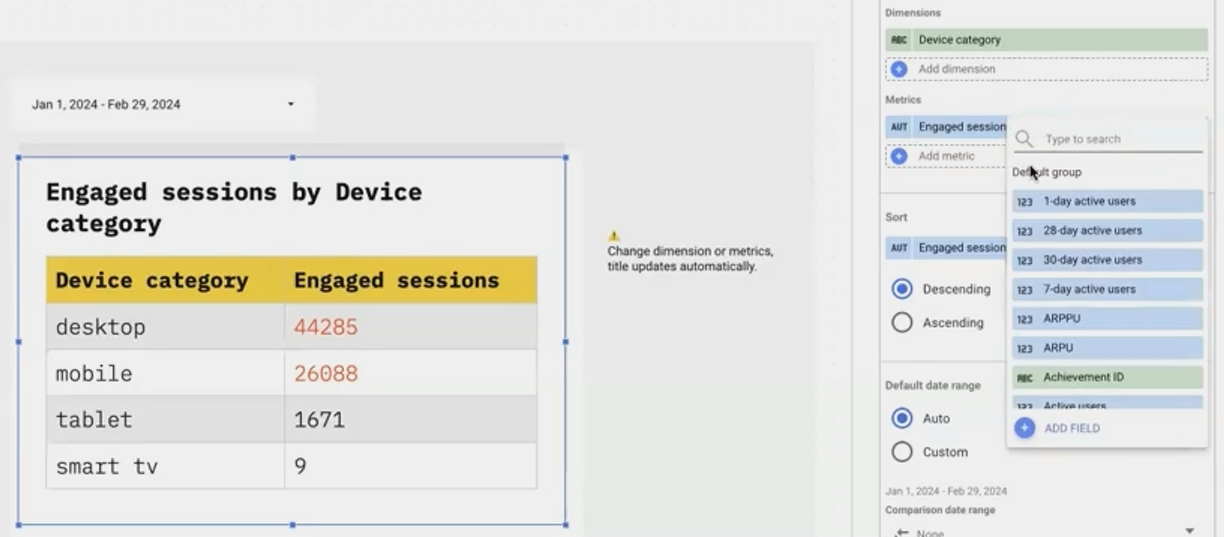
The table's title updates automatically when you change the selected metrics or dimensions, displaying "Engaged Sessions by Device Category" or "New Users by Age Group" based on your selections.
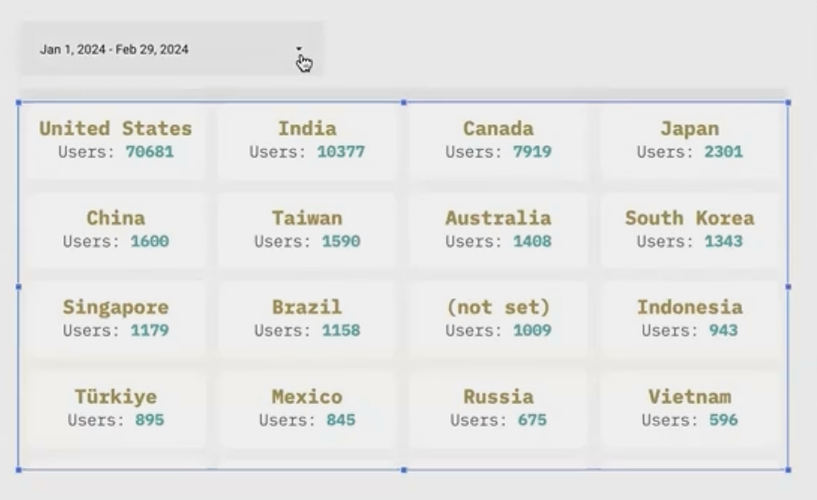
6. Responsive Cards
Perhaps the most impressive example showcases templr.pro's ability to overcome two significant Looker Studio limitations:
The 50-chart limit per page
Lack of responsive design for mobile viewing
Using templr.pro, you can create responsive card layouts that dynamically generate a card for each value in your dimension—even if there are hundreds of them. For example, showing sessions by country for 162 different countries (more than three times the standard chart limit):
<div class="cards-container">
  {{#each dimensions.0.values}}
    <div class="card">
      <h3>{{this}}</h3>
      <p>{{lookup ../metrics.0.values @index}}</p>
    </div>
  {{/each}}
</div>
.cards-container {
display: flex;
flex-wrap: wrap;
gap: 10px;
}
.card {
flex: 1 0 23%;
min-width: 200px;
padding: 15px;
border-radius: 8px;
box-shadow: 0 2px 5px rgba(0,0,0,0.1);
}
The cards automatically rearrange from four columns to three (or fewer) as you resize the component, providing true responsive behavior in Looker Studio.
Frequently Asked Questions (FAQs)
Are there performance concerns with templr.pro?
Surprisingly, templr.pro often loads faster than native Looker Studio components. In testing, templr.pro components rendered more quickly than built-in tables when refreshing reports with date range changes.
Is templr.pro difficult to resize on the canvas?
This is a known issue affecting all community visualizations, not just templr.pro. Because community visualizations load in a sandboxed iframe, Looker Studio sometimes struggles to detect resize handles. The trick is to carefully position your mouse exactly on the edge of the component before dragging.
Do I need to be a developer to use templr.pro?
While basic HTML and CSS knowledge is required, you don't need to be a professional developer. If you've ever built a simple webpage or modified a website template, you have the skills needed to use templr.pro effectively.
Is templr.pro secure? Will it expose my data?
Templr.pro operates within the same security constraints as all community visualizations. It cannot send your data to external servers or save copies of your data. It simply renders the data that Looker Studio provides within its sandbox environment.
Templr.pro represents a significant advancement in Looker Studio customization, democratizing the creation of custom visualizations. What once required days of specialized development work can now be accomplished in minutes with basic web skills.
By leveraging this powerful tool, you can create reports that are not only more visually appealing but also more functional, responsive, and aligned with your brand identity, all without hitting Looker Studio's native limitations.
Whether you're looking to add custom fonts, conditional content, responsive layouts, or entirely new visualization types, templr.pro offers a flexible, accessible solution that will transform your Looker Studio reporting capabilities.
Note:
This post is based on a subject covered in the Looker Studio Masterclass Program. To learn more about Looker Studio Masterclass, click here.