
Looker Studio Data Sources Explained: How to Optimize Caching, Credentials & Connections
Welcome to the ultimate guide on managing data sources in Looker Studio! Whether you're creating your first marketing dashboard or you're a seasoned analyst looking to optimize your reporting workflow, understanding how data sources work is fundamental to building efficient, reliable, and powerful reports.
In this comprehensive guide, we'll explore the ins and outs of Looker Studio data sources - from connecting them to reports, to choosing between embedded and reusable options, to managing credentials and optimizing data freshness. By the end, you'll have the knowledge to make strategic decisions that will enhance your reporting experience and deliver more value to your stakeholders.
Let's dive in!
What Are Data Sources and Why Do They Matter?
At their core, data sources are the bridge between your raw data and your visualizations. They contain all the settings and credentials needed to extract data from various platforms through connectors. Data sources receive the extracted data, organize it into fields (dimensions and metrics), can transform it through calculated fields, and ultimately provision this data to your reports for visualization.
Understanding how data sources work is essential because they determine:
How fresh your data is
Who can access your data
How efficiently your reports load
How consistently your metrics are defined across reports

Connecting Data Sources to Reports
One of the most powerful aspects of Looker Studio is its flexibility in connecting multiple data sources to a single report. This allows you to create comprehensive dashboards that pull data from various platforms like Google Analytics, Google Ads, Facebook, and more, all in one place.
Multiple Sources in One Report
You can connect as many data sources as needed to a single report. This is particularly useful when you need to visualize data from different marketing channels or business units side by side.
For example, you might create a marketing dashboard with:
Google Analytics data for website performance
Google Ads data for paid search campaigns
Facebook Ads data for social media campaigns
BigQuery data for custom business metrics
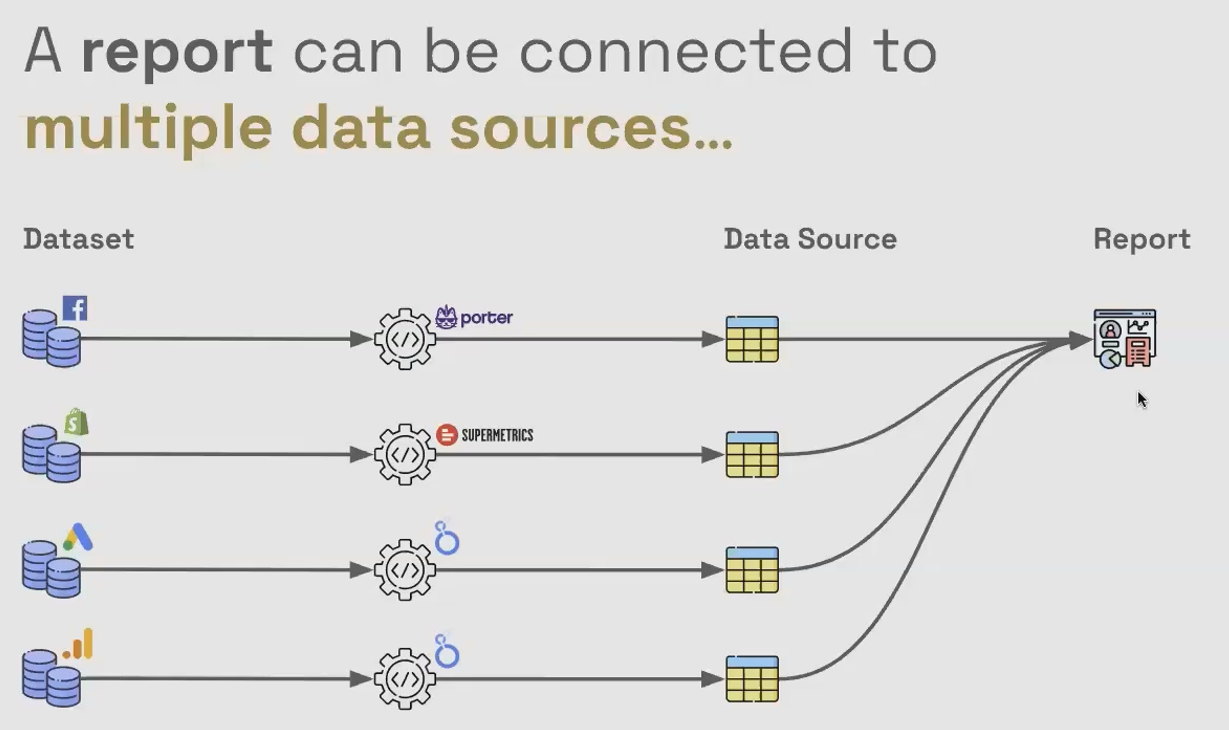
Each of these would be a separate data source within your report, allowing you to create a comprehensive view of your marketing ecosystem.
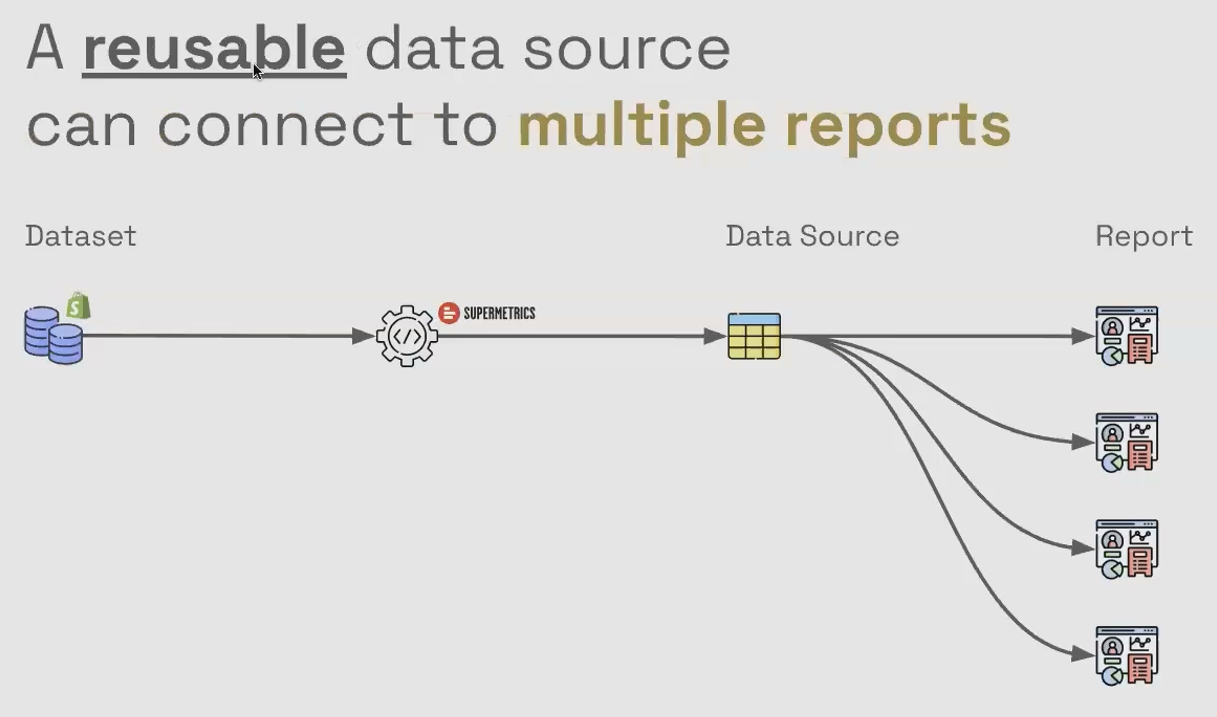
One Source in Multiple Reports
Conversely, you can also connect a single reusable data source to multiple reports. This approach offers significant advantages for teams and organizations that need consistent metrics across different dashboards.
When you use a reusable data source across multiple reports:
You can make changes once and have them propagate everywhere
You ensure consistent definitions of KPIs across all reports
You reduce the maintenance burden when data structures change
Imagine you've created a custom field that calculates Customer Acquisition Cost (CAC) using a complex formula. If this formula needs to be updated (perhaps to include a new marketing channel) you can make the change once in the reusable data source rather than hunting down every report where this calculation might exist.
Embedded vs. Reusable Data Sources: Making the Right Choice
One of the first decisions you'll need to make when working with Looker Studio is whether to use embedded or reusable data sources. Each has its strengths and is suited to different use cases.
Embedded Data Sources: Self-Contained and Simple
An embedded data source lives entirely within the report where it was created. When you click "Add Data" while building a report and connect to a data source, you're creating an embedded data source by default.
Advantages of Embedded Data Sources:
Simplicity: Everything is contained within a single report
Portability: When you duplicate the report, the data source and all its settings are duplicated with it
Permission Simplicity: Anyone with edit access to the report automatically has edit access to the embedded data sources
Best for:
One-off reports
Proof-of-concepts
Reports that will never need to be replicated
Quick analyses where consistency with other reports isn't critical
Reusable Data Sources: The Enterprise Approach
A reusable data source exists independently of any report. It's created from the Looker Studio home page and can be connected to multiple reports.
Advantages of Reusable Data Sources:
Consistency: Changes to calculated fields propagate to all connected reports
Maintenance Efficiency: Update settings, credentials, or fields in one place
Permission Control: You can give someone edit access to a report without giving them edit access to the data source
Best for:
Enterprise reporting ecosystems
Teams that need consistent metrics across multiple reports
Scenarios where data source settings might need to change over time
Reports that will be duplicated or templated for different entities (e.g., different clients or departments)
Pro Tip: According to recent documentation (as of July 2025), you can convert an embedded data source to a reusable one, but not vice versa. If you think you might need to reuse a data source later, it's often better to start with a reusable data source.
Data Credentials: Controlling Who Can Access Your Data
Data credentials determine whose authentication is used when Looker Studio connects to your data. This setting is crucial for security, governance, and ensuring your reports work for the right people.
Owner's Credentials: Simplicity and Broad Access
When you use owner's credentials, the data source uses the credentials of the person who created it to access the underlying data. This means that anyone viewing the report can see the data, even if they don't have direct access to the source system.
When to use Owner's Credentials:
For public dashboards where viewers shouldn't need access to the raw data
When sharing reports with clients who don't have direct access to your analytics platforms
For internal dashboards where you want to minimize access management
When you're creating a template report that will be used by many people with different access levels

Potential drawbacks:
If the owner leaves the organization or loses access, all reports using that data source will break
Less granular control over who sees what data
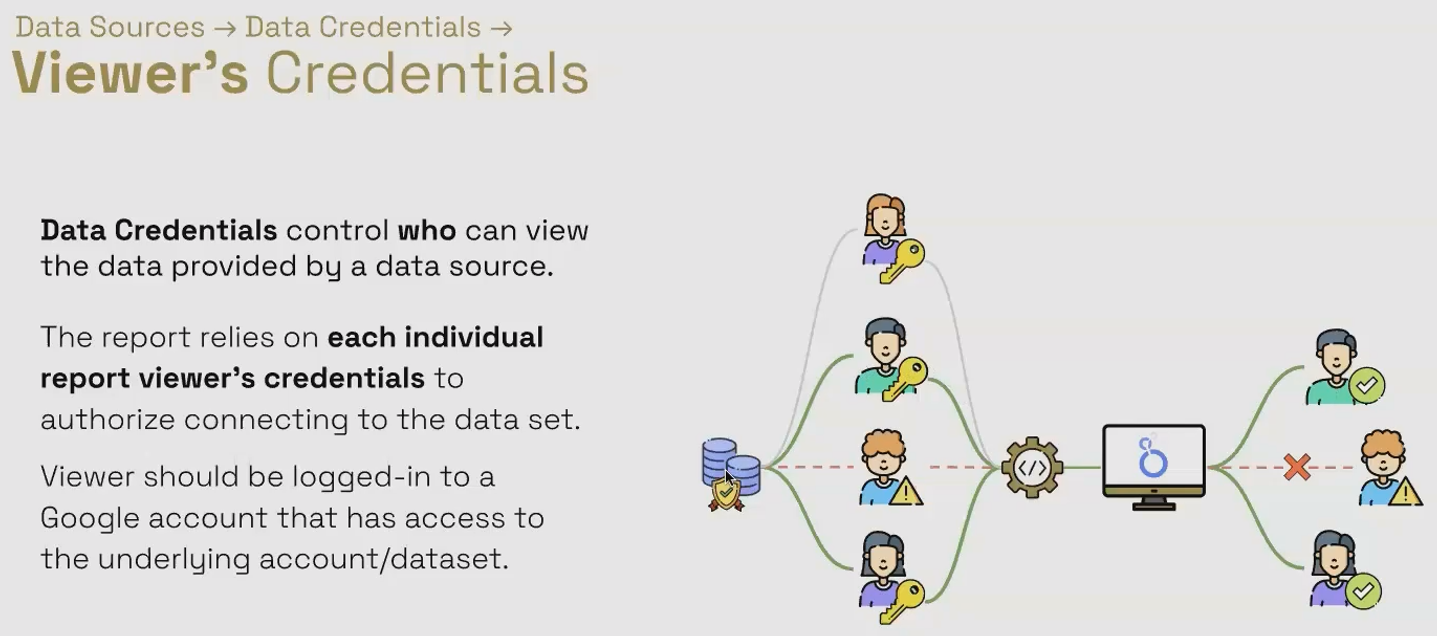
Viewer's Credentials: Security and Governance
With viewer's credentials, each person viewing the report must have their own access to the underlying data source. Looker Studio will use their credentials to fetch the data when they view the report.
When to use Viewer's Credentials:
For sensitive data where access needs to be strictly controlled
In organizations with strong data governance requirements
When different viewers should see different data based on their access levels
When you want changes in the source system's permissions to be automatically reflected in report access
Potential drawbacks:
More complex to set up and maintain
Every viewer needs access configured in the source system
Can create confusion when viewers can't see data they expect to see
Real-World Scenario: If you're creating a sales dashboard for regional managers, using viewer's credentials would ensure each manager only sees data for their own region (assuming permissions are set up this way in the source system).
Caching & Data Freshness: Balancing Speed and Timeliness
One of the most common misconceptions about Looker Studio is that it always fetches fresh data. In reality, Looker Studio uses a caching system to improve performance, and understanding how this works is essential for creating efficient reports.
How Caching Works in Looker Studio
When a chart or component loads, Looker Studio fetches only the specific data needed for that component from the data source. It then caches this data for a period determined by the "data freshness" setting.
For subsequent loads of the same component (with the same filters, date ranges, etc.), Looker Studio will use the cached data until the freshness period expires, rather than querying the source system again.
This significantly improves loading speed, especially for complex queries or large datasets, but it means your data isn't always up-to-the-minute fresh.
Configuring Data Freshness Settings
Different data connectors offer different data freshness options:
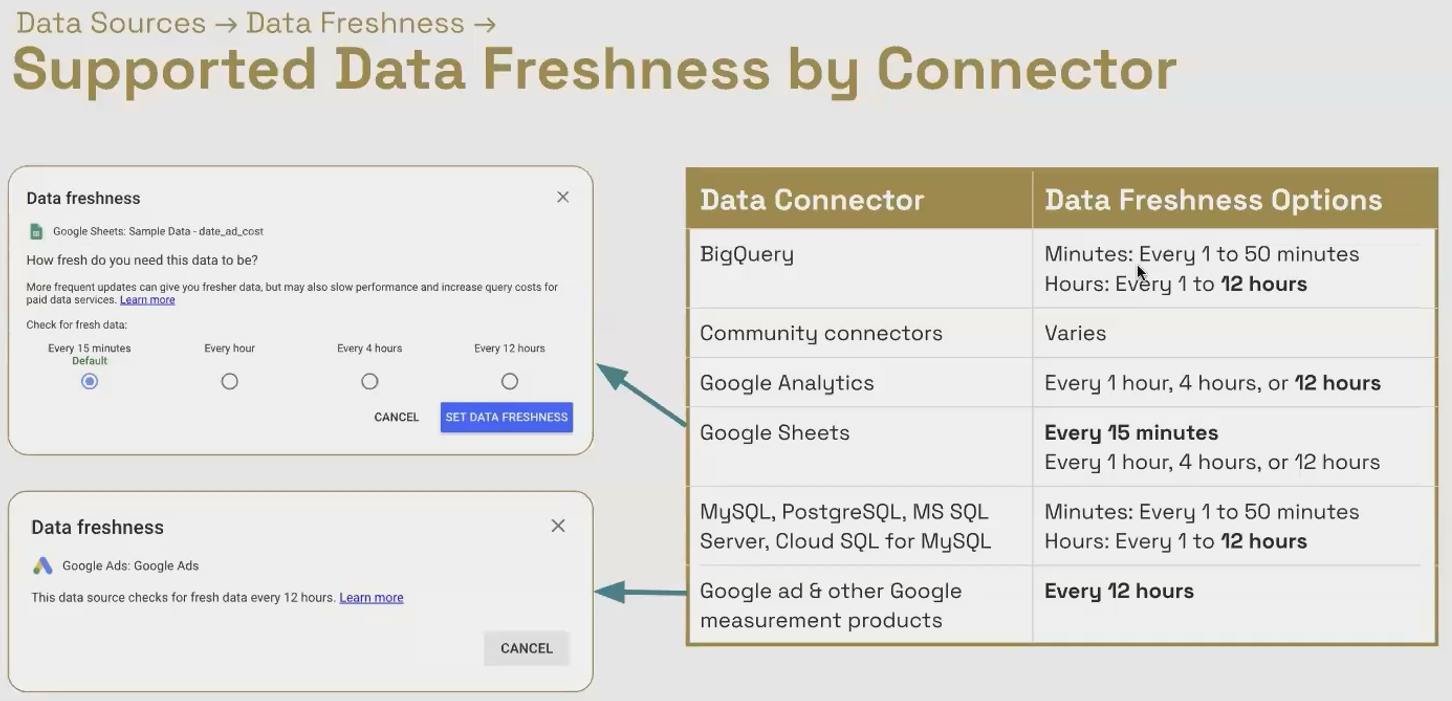
To change the data freshness setting:
Edit your data source
Look for the "Data Freshness" option
Select the appropriate interval based on your needs

Strategic Considerations for Data Freshness
Setting the right data freshness interval requires balancing several factors:
Data Volatility: How frequently does your underlying data change?
Reporting Urgency: How critical is it for users to see the latest data?
Performance Impact: Shorter freshness intervals mean more queries and potentially slower loading
Cost Implications: For BigQuery and some other connectors, more frequent queries can increase costs
For a real-time sales dashboard that executives check hourly, you might set a 15-minute or 1-hour freshness. For a monthly marketing report, 12 hours might be perfectly adequate.
Pro Tip: For report editors, you can manually refresh data at any time by clicking the three-dot menu and selecting "Refresh data." This bypasses the cache and fetches fresh data, regardless of the data freshness setting. However, this option isn't available to viewers.
Frequently Asked Questions (FAQs)
Does the "data last updated" timestamp in the report footer show in the viewer's local time zone?
Yes, the timestamp is automatically converted to the local time zone of the person viewing the report. This means viewers in different time zones will see different times, but they all reflect when the data was last refreshed relative to their location.
If I change something in my source data, why isn't it showing up in my Looker Studio report even after refreshing the page?
Refreshing the browser page doesn't bypass the data cache. The data will only refresh when (1) the data freshness period expires, (2) a report editor manually refreshes the data, or (3) you change a filter, date range, or field selection that requires new data.
Can I give someone permission to refresh data without giving them edit access to the entire report?
Unfortunately, no. Currently, only users with edit access to the report can use the "Refresh data" function. This is a limitation in Looker Studio that many users have requested Google to address.
What happens to my embedded data sources if I delete a report?
When you delete a report, all embedded data sources within that report are deleted as well. This is why reusable data sources are more durable for important data connections that you might need across multiple reports.
Can I convert a reusable data source to an embedded one?
You can't directly convert a reusable data source to an embedded one. However, you can duplicate the reusable data source within a report, which will create an embedded copy with all the same settings and calculated fields.
Mastering data sources in Looker Studio is fundamental to creating efficient, consistent, and reliable reports. By understanding the differences between embedded and reusable data sources, strategically configuring data credentials, and optimizing data freshness settings, you can create a reporting infrastructure that balances performance, governance, and user experience.
Remember that there's no one-size-fits-all approach, the right choices depend on your specific reporting needs, organizational structure, and data governance requirements. Take the time to think strategically about your data source configuration, and you'll build a foundation for reporting success.
Whether you're creating a one-off analysis or building an enterprise-wide reporting ecosystem, these principles will help you make the most of Looker Studio's powerful data connectivity features.
Note:
This post is based on a subject covered in the Looker Studio Masterclass Program. To learn more about Looker Studio Masterclass, click here.