
Elevate Your Looker Studio Reports with Private Visualizations: Funnel Pro & Google Fonts Tutorial
Are you tired of the standard visualizations in Looker Studio? Looking for ways to make your reports stand out with branded elements and powerful custom charts? Then you'll love what's coming next in our exploration of Looker Studio's hidden gems.
Today, we're focusing on two game-changing private community visualizations that can transform your reporting: Funnel Pro and Google Fonts. Unlike public visualizations available in the gallery, these custom-built tools offer unique capabilities for professionals who need more from their data storytelling.
Let's dive in and discover how these tools can elevate your Looker Studio reports!
What Are Private Community Visualizations?
Before we explore our featured visualizations, let's understand what makes private community visualizations different from their public counterparts.
While public visualizations appear in Looker Studio's gallery for everyone to use, private visualizations remain accessible only to those who have the specific manifest path - essentially, a direct link to where the visualization's code is stored in Google Cloud Storage.
This exclusivity often means these visualizations are:
Custom-built for specific use cases
More specialized in functionality
Sometimes more powerful than public alternatives
Perfect for brand-specific reporting needs
How to Add Private Visualizations to Your Reports
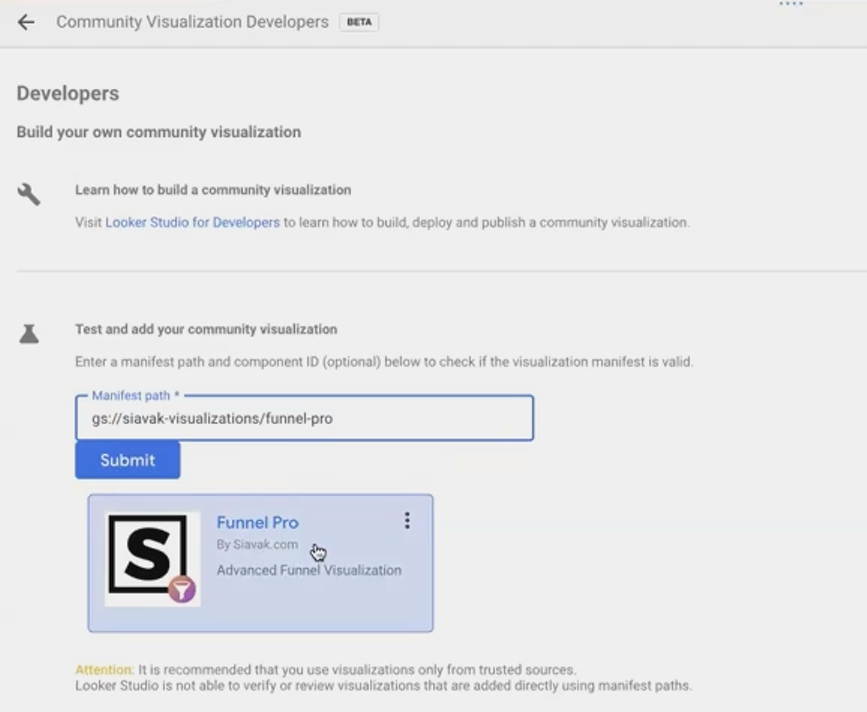
Adding a private visualization requires a slightly different approach:
Obtain the manifest path from the developer (it typically starts with
gs://)In Looker Studio, click on the Community Visualizations icon
Select "Explore More"
Click "Build your own visualization"
Paste the manifest path and component ID
Click enter to load the visualization
Add it to your report like any other chart
Now, let's explore two powerful private visualizations that can transform your reporting capabilities.
Funnel Pro: Advanced Conversion Visualization
What Makes Funnel Pro Special?
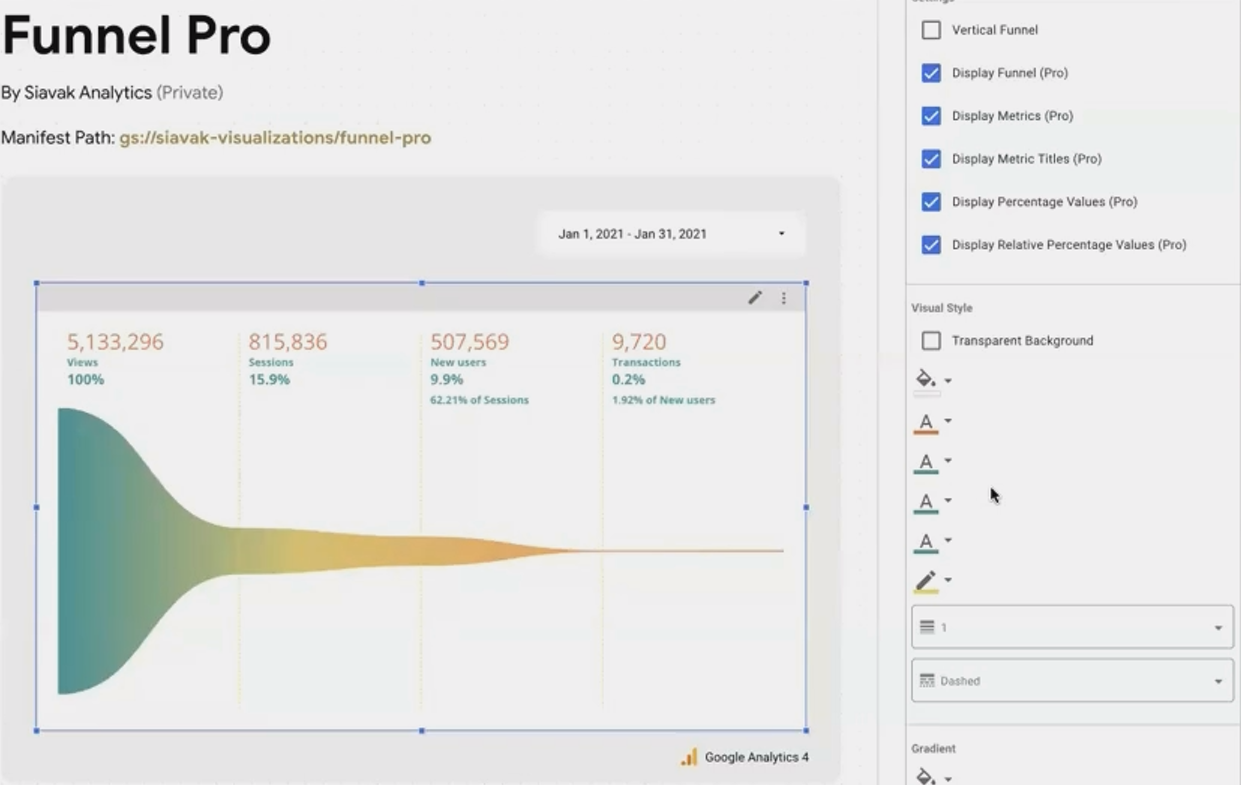
When standard funnel visualizations fall short, Funnel Pro steps in with enhanced flexibility and features. Developed by Siavak for client reporting needs, this visualization offers:
Multi-metric support: Add up to four metrics in the free version, with each metric becoming a step in your funnel
Dynamic conversion calculations: Automatically displays both raw numbers and conversion percentages between steps
Flexible display options: Choose between showing metrics or relative percentage values
Customization options: Adjust all visual elements including colors, lines, and layouts
Orientation choice: Display horizontally or vertically based on your report layout needs
Real-World Applications
Funnel Pro excels in visualizing:
Marketing conversion funnels (Awareness → Consideration → Decision → Action)
Website user journeys (Visitors → Signups → Activations → Retained Users)
Sales pipelines (Leads → Qualified Leads → Proposals → Closed Deals)
E-commerce checkout processes (Cart Adds → Checkout Starts → Shipping Info → Payment → Purchase)
How to Get Started with Funnel Pro
To add Funnel Pro to your reports, use this manifest path:
gs://siavak-visualization/funnel/manifest.jsonThen simply add your metrics in the order you want them to appear in your funnel. The visualization will handle the rest, calculating conversion rates and displaying the data in an intuitive, visually appealing format.
Google Fonts: Brand-Perfect Typography

Custom typography options beyond Looker Studio's limited font selection
Why Google Fonts Changes Everything
One of the biggest limitations in Looker Studio has always been its restricted font selection. With roughly 20-30 standard fonts available, creating truly branded reports often meant compromising on typography.
The Google Fonts visualization solves this problem by allowing you to use any font from the Google Fonts library - over 1,000 options - directly in your reports. This means:
Perfect brand alignment with your company's official typography
Support for non-Latin scripts (Arabic, Chinese, Urdu, etc.)
Access to decorative fonts for headers and special elements
Consistent typography across all your marketing materials
How It Works
This visualization functions as a simple text component with unlimited font possibilities:
Add the Google Fonts component to your report
Write your desired text in the component
Visit Google Fonts to select your font and get its URL
Enter the font family name in the component settings
Apply any additional CSS styling you want (size, alignment, color, etc.)
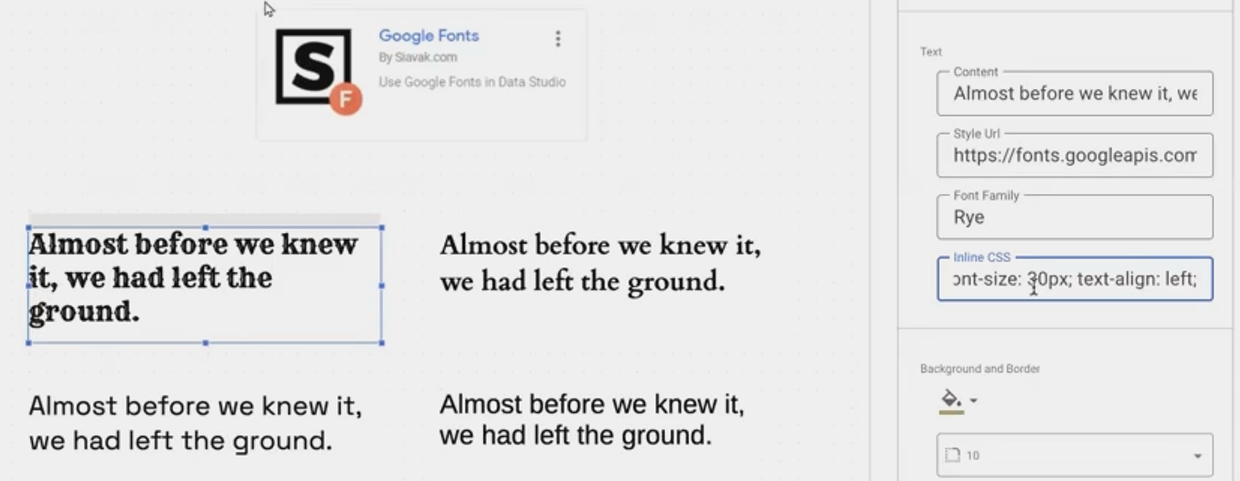
The result is text that perfectly matches your brand guidelines, making your reports look more professional and cohesive with your other marketing materials.
Beyond Basic Text
While simple in concept, the Google Fonts component opens up possibilities for:
Section headers with brand-perfect typography
Call-out text with distinctive styling
Multi-language reports with appropriate typography for each script
Decorative elements that maintain brand consistency
How to Get Started with Google Fonts
To add Google Fonts to your reports, use this manifest path:
gs://siavak-visualization/gallery/manifest.jsonFrequently Asked Questions (FAQs)
Will these private visualizations affect the performance of my Looker Studio reports?
Not significantly. Well-optimized community visualizations can load just as fast as native Looker Studio charts. In some cases, they may even load faster! During testing, we observed that templr.pro components often loaded faster than built-in tables.
Are private community visualizations difficult to resize or position on the canvas?
Yes, this is a known issue affecting all community visualizations, including Google's own. The challenge stems from how these components load in a sandboxed iframe. The trick is to carefully grab the header or very edge of the component when moving or resizing. Google is aware of this issue and will hopefully address it in future updates.
Can I use these visualizations in client-facing reports?
Absolutely! These visualizations are designed for professional use and appear seamlessly integrated into your reports. Recipients won't know they're looking at a community visualization rather than a native Looker Studio component.
What if I need to create a custom visualization for a specific reporting need?
If you have basic HTML, CSS, and JavaScript skills, consider using templr.pro - a low-code solution for creating custom visualizations. Alternatively, you can work with developers who specialize in creating Looker Studio community visualizations for custom solutions.
Private community visualizations like Funnel Pro and Google Fonts represent the cutting edge of what's possible in Looker Studio. By extending beyond the platform's native capabilities, these tools allow you to create more branded, functional, and impressive reports.
Whether you're tracking conversion funnels with precision or ensuring your typography perfectly matches your brand guidelines, these private visualizations give you the power to elevate your data storytelling to new heights.
Ready to take your Looker Studio reports to the next level? Start by implementing these powerful visualizations today!
Note:
This post is based on a subject covered in the Looker Studio Masterclass Program. To learn more about Looker Studio Masterclass, click here.