
Looker Studio Data Source Management: 5 Pro Techniques to Save Time and Boost Efficiency
As you dive deeper into Looker Studio's capabilities, effective data source management becomes a crucial skill that separates casual users from true data visualization professionals. In this post, we'll explore the best practices for managing your data sources in Looker Studio – helping you create more sustainable, efficient, and scalable reporting solutions for yourself and your clients.
Whether you're juggling multiple client accounts or building complex dashboards for your organization, these strategies will save you countless hours and prevent common headaches down the road.
What Are Your Data Source Management Options?
Looker Studio offers several powerful ways to manage your data sources, each serving different needs in your reporting workflow. Let's explore these options one by one.
Sharing Reusable Data Sources
One of the most powerful features of Looker Studio is the ability to share reusable data sources with team members or clients.
To share a reusable data source:
Navigate to your Looker Studio home page
Locate the data source you want to share
Click on the three-dot menu next to the data source
Select "Share"
Enter the email addresses of the people you want to share with
Choose whether they can view or edit the data source
This capability is particularly valuable when working in teams, as it ensures everyone is working with the same data definitions and calculations. When you update a shared reusable data source, all reports connected to it will reflect those changes instantly.
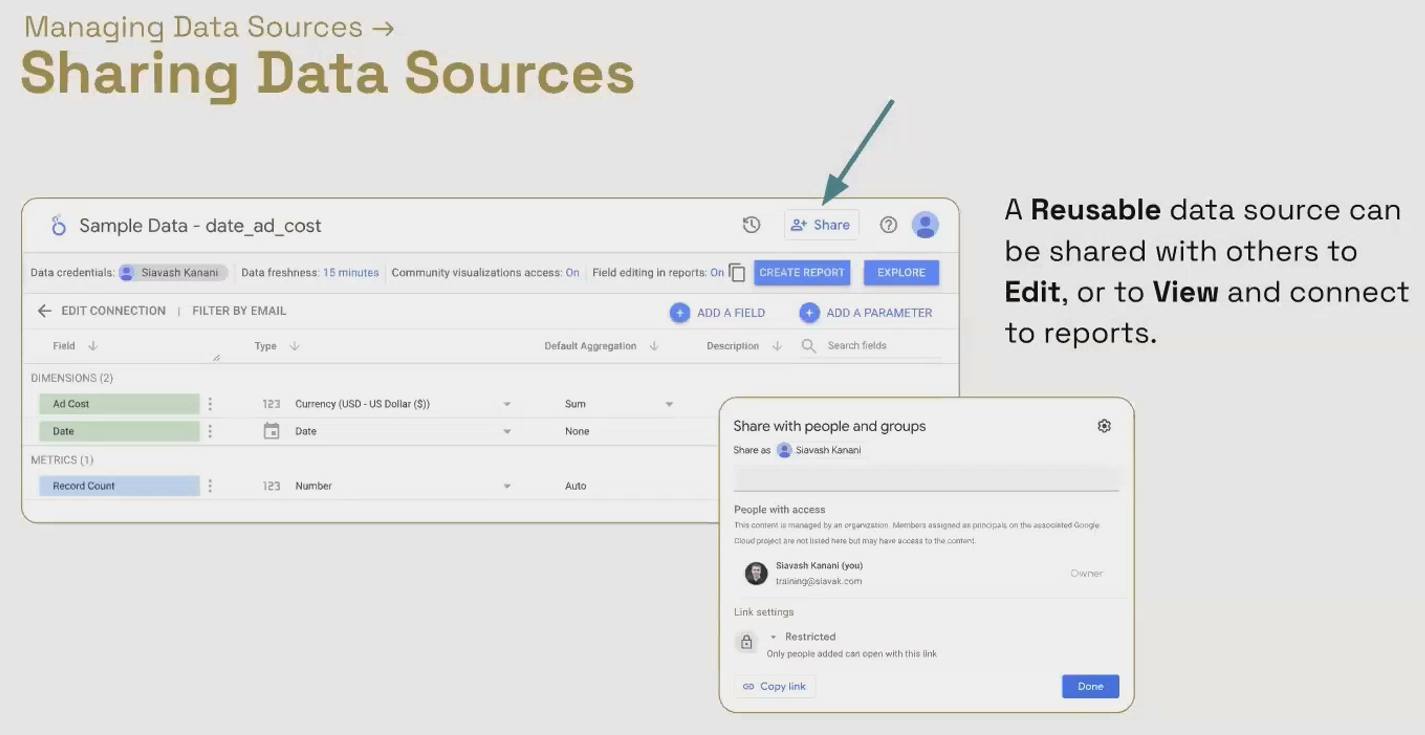
The sharing interface allows you to grant either view or edit access to your data sources.
Duplicating Data Sources for Efficiency
Creating reports for multiple accounts or clients often involves similar metrics and calculations. Rather than building everything from scratch each time, you can duplicate existing data sources and reconnect them to different data sets.
When you duplicate a data source, all custom fields, formatting settings, and data freshness configurations come along for the ride. This is invaluable for maintaining consistency across reports while dramatically reducing setup time.
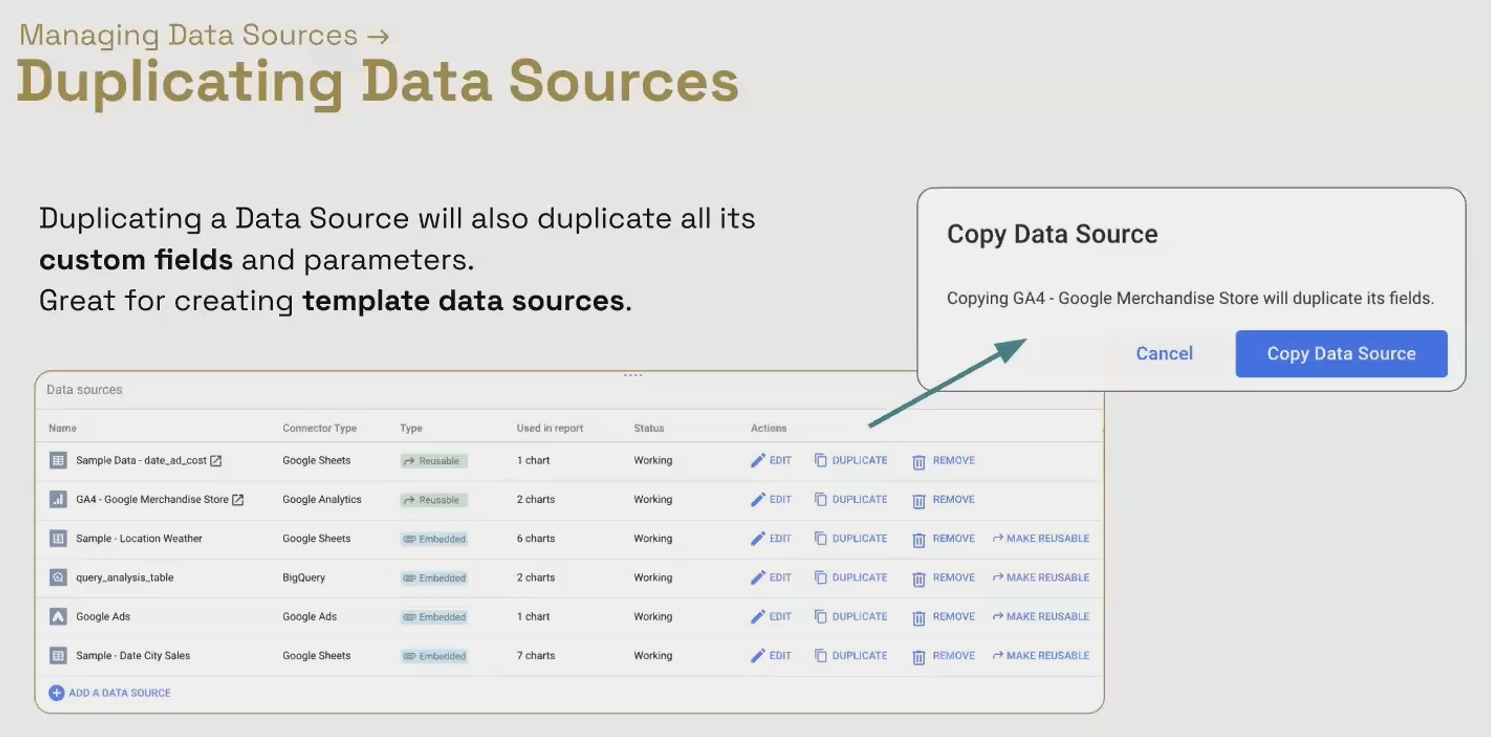
For example, if you've created 50 calculated fields with complex formulas for a client's Google Ads account, you can duplicate that data source, reconnect it to another account, and immediately have all those calculations ready to go.
Refreshing Fields to Capture Schema Changes
Data sources aren't always static. When you:
Add new columns to a Google Sheet
Create new custom dimensions in Google Analytics
Add fields to a BigQuery table
These changes won't automatically appear in your Looker Studio data source. You need to explicitly refresh the field list.
To do this:
Edit your data source
Scroll to the bottom of the field list
Click the "Refresh fields" button
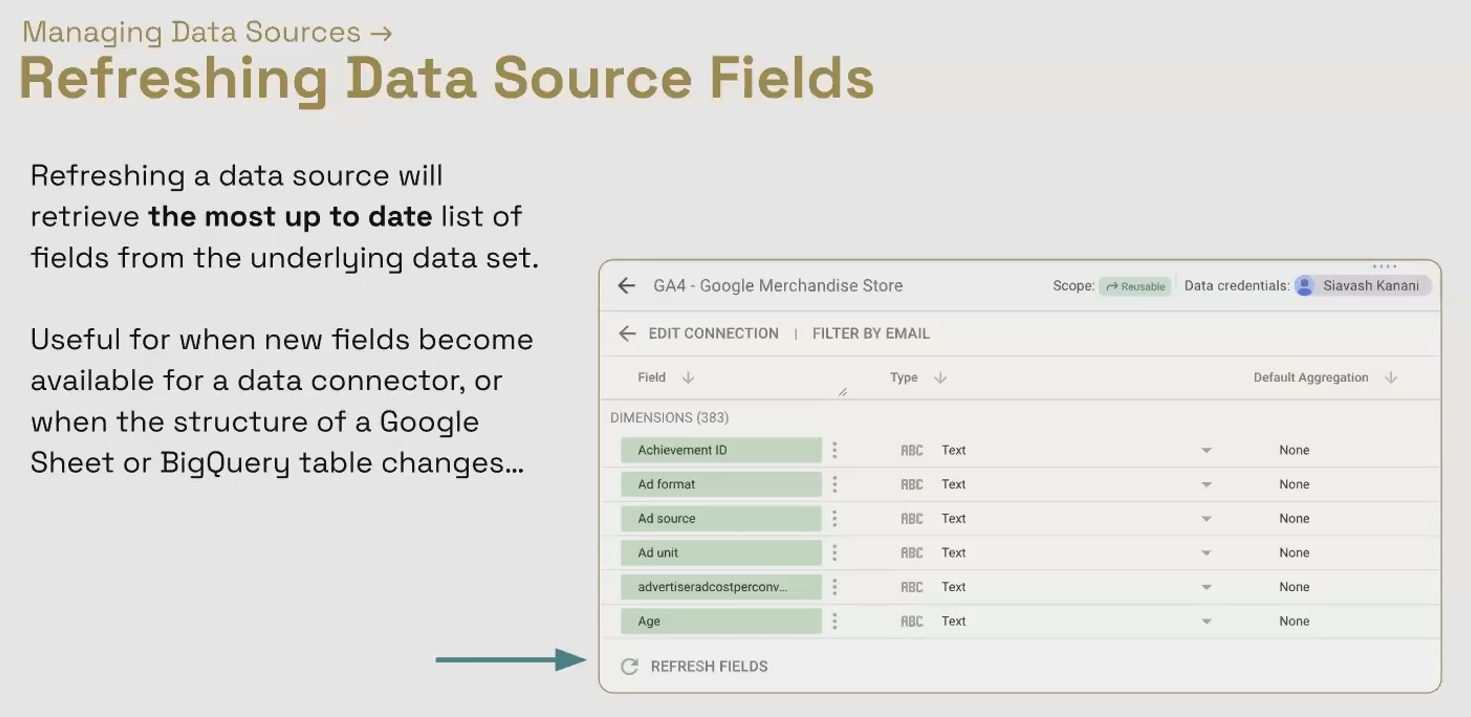
This action prompts Looker Studio to re-examine the underlying data set and update its schema accordingly. It's a critical step when working with evolving data structures, especially during development phases.
Reconnecting Data Sources
Sometimes you need to point an existing data source at a different underlying data set while preserving all your custom configurations. The reconnect feature makes this possible.
Common scenarios for reconnecting include:
Switching from development to production environments
Moving from one client account to another
Updating from an old Google Sheet to a new version
To reconnect a data source:
Edit the data source
Click "Edit Connection" at the top
Select the new account, property, view, or file you want to connect to
Save your changes
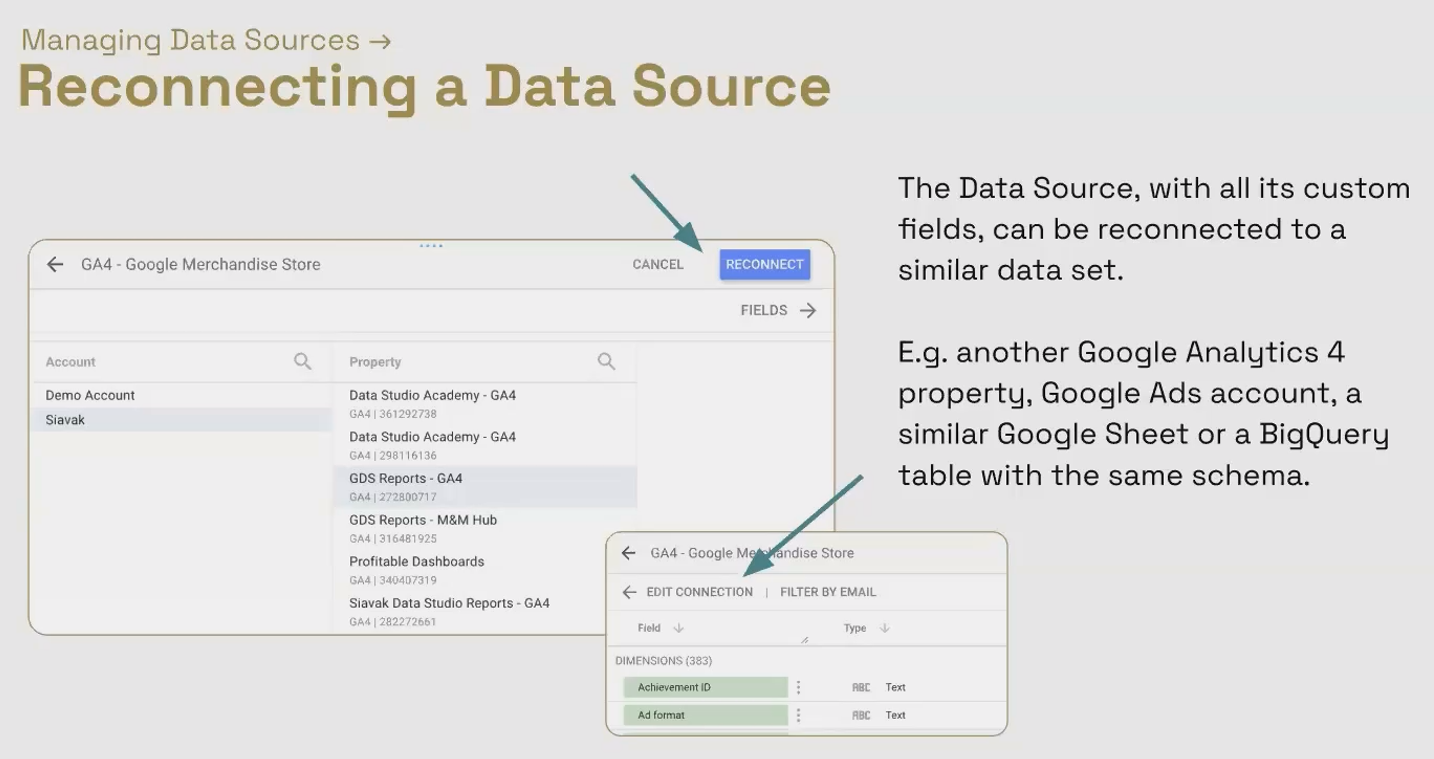
All your custom fields and settings remain intact, just now pulling from the new source.
Converting Embedded to Reusable Data Sources
As your reporting needs evolve, you might find that an embedded data source you created within a single report would be valuable across multiple reports. Fortunately, Looker Studio allows you to convert embedded data sources to reusable ones.
This process extracts the data source from its parent report and places it in your Looker Studio account as a standalone asset that can be connected to multiple reports.
To convert an embedded data source:
Edit the data source from within the report
Look for the "Reusable data source" option under data source settings
Toggle it from "Off" to "On"
Save your changes
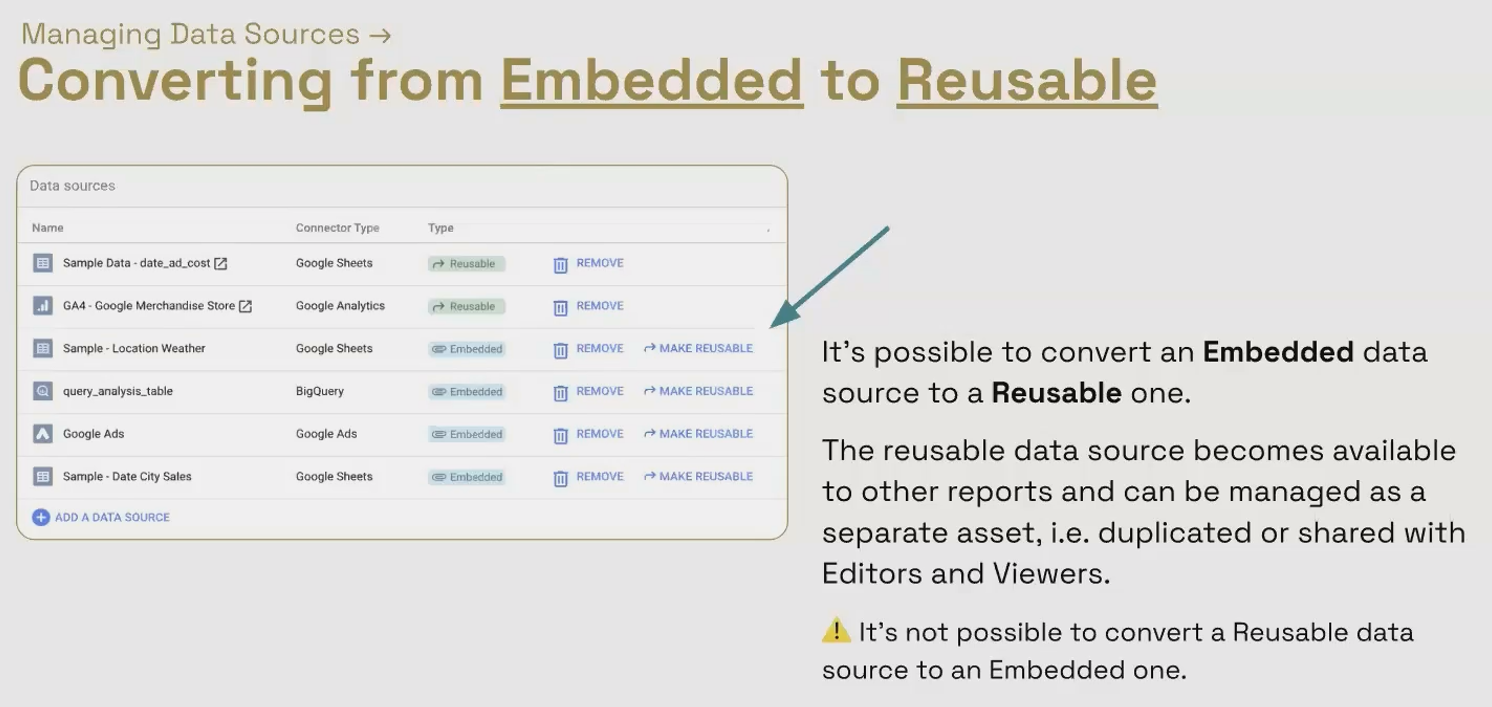
Keep in mind that once a data source becomes reusable, it needs to be managed separately from the report. Changes to the data source will affect all connected reports, which can be powerful but requires more careful consideration.
Implementing a Professional Naming Convention
When you're managing dozens or even hundreds of data sources across multiple clients and projects, a consistent naming convention becomes essential. Without one, finding the right data source quickly becomes nearly impossible.
Here's a battle-tested naming convention that has served me well across numerous client projects:
[Client Code] - [Tool] - [Connector] - [Account/View/Entity]
Breaking this down:
Client Code: A 3-4 letter abbreviation that identifies the client (e.g., ABC for ABC Corporation)
Tool: The platform where the data originates (GA4, Google Ads, BigQuery, etc.)
Connector: The specific connector used (Built-in, Supermetrics, Funnel, etc.)
Account/Entity: The specific account, property, or table within that tool
For example:
ABC - GA4 - Built-in - Main WebsiteXYZ - BigQuery - Built-in - marketing_data.campaignsDEF - Google Ads - Supermetrics - Performance Max
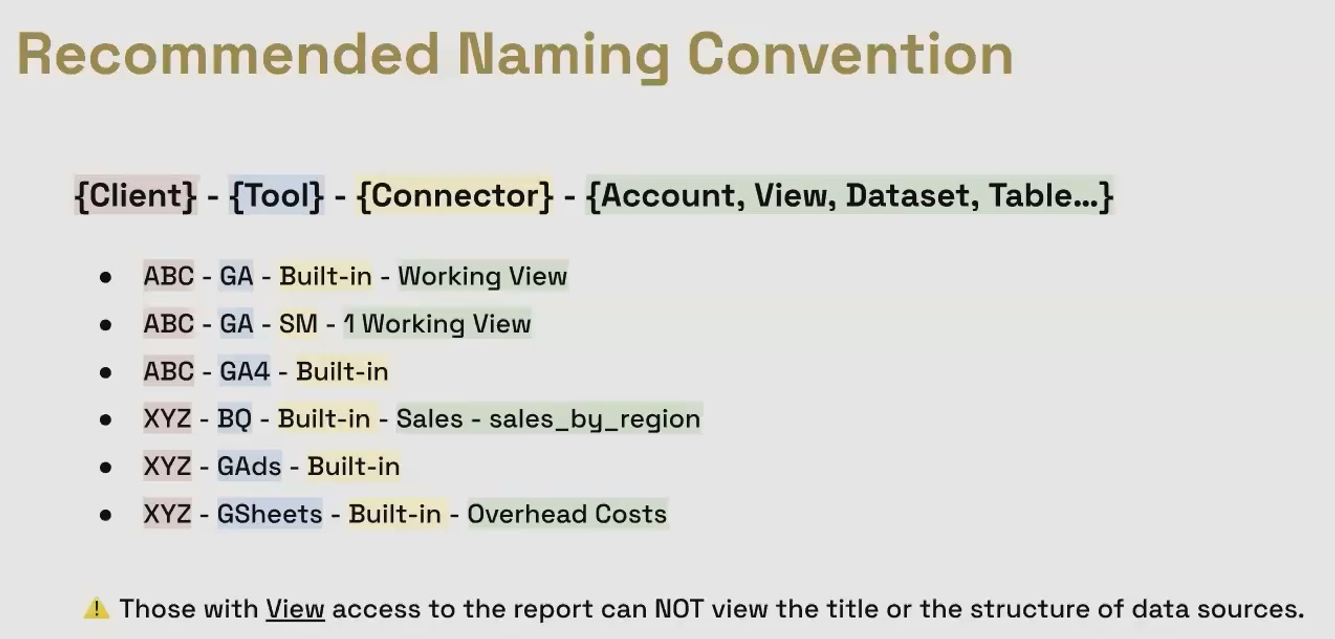
This approach makes it immediately clear what each data source contains and who it belongs to. It's especially helpful when you need to quickly locate a specific data source months after creating it.
Pro Tip: Remember that viewers of your report cannot see the names of your data sources. This naming convention is purely for your internal organization and team collaboration.
Frequently Asked Questions (FAQs)
Is there an easy way to see which charts in my report are using a specific data source?
While there's no global view for the entire report, you can identify all charts using a specific data source on a page-by-page basis. Simply right-click on any chart that uses the data source in question and select "Select charts with this data source on page." This will highlight all components on that page connected to that data source.
If I convert an embedded data source to a reusable one, will it affect my existing report?
No, your existing report will continue to function normally. The conversion simply makes the data source available to other reports as well. However, be aware that any subsequent changes you make to the now-reusable data source will affect both the original report and any new reports you connect it to.
Can I convert a reusable data source back to an embedded one?
Unfortunately, no. Once a data source is made reusable, it cannot be converted back to an embedded data source. This is because a reusable data source might be connected to multiple reports, and there would be no way to determine which report it should be embedded in.
What happens to my data source if the person who created it leaves the organization?
This depends on the credential type used. If the data source uses "Owner's credentials" and the owner leaves, the reports using that data source will stop working. This is why using service account credentials (for BigQuery) or viewer credentials can be more sustainable for organization-wide reports.
Effective data source management is just one aspect of becoming a Looker Studio power user. As you get comfortable with these techniques, you'll find your reporting workflows becoming more efficient and your dashboards more sustainable over time.
Remember that good data source management isn't just about technical organization, it's about creating a foundation that allows you to focus on delivering insights rather than wrestling with configuration issues.
By implementing the practices outlined in this post, you'll be well on your way to creating Looker Studio reports that not only look great but are built on a solid, maintainable foundation.
Note:
This post is based on a subject covered in the Looker Studio Masterclass Program. To learn more about Looker Studio Masterclass, click here.