
Advanced BigQuery Features in Looker Studio: BI Engine, Service Accounts & 1-Minute Refresh Hacks
As a Looker Studio power user, you've likely already explored basic data connections. But when it comes to serious data analysis, BigQuery integration stands out as the heavyweight champion in the Looker Studio ecosystem. Today, I'll walk you through some game-changing features that make BigQuery an essential tool for creating professional dashboards.
Whether you're building dashboards for clients or your own organization, these advanced BigQuery features will take your Looker Studio reports to the next level. Let's dive in!
Why BigQuery Shines in Looker Studio
BigQuery's integration with Looker Studio isn't just another connector option—it's a match made in data heaven. As Google products, they work together seamlessly, with optimizations that other data sources simply can't match.
In my client projects, we typically perform data transformation, processing, and preparation in BigQuery, creating clean, flat tables ready for visualization. This approach leverages each tool's strengths: BigQuery for powerful data processing and Looker Studio for beautiful visualization.
BI Engine: Turbocharge Your BigQuery Reports
One of the most powerful yet underutilized features in the BigQuery-Looker Studio partnership is BI Engine.
BI Engine is an in-memory analysis service that dramatically accelerates query performance. Instead of reading from disk storage each time, BI Engine intelligently caches frequently accessed data in RAM, delivering sub-second query responses.
The best part? Every Looker Studio user gets 1GB of BI Engine capacity for free!
This means if your queries process less than 1GB of data (which is often the case for visualization queries), they're automatically accelerated at zero additional cost. For larger datasets, you can reserve additional memory (up to 250GB), though this comes with additional charges of approximately $30 per month per gigabyte.
When to Consider Upgrading BI Engine Capacity
As your data grows, you might notice your once-zippy dashboards slowing down. This often happens when your queries exceed the free 1GB threshold. At this point, it's worth having a conversation with your client or team about adding more BI Engine capacity to maintain performance.
According to Google Cloud documentation, BI Engine can improve query performance by 4-10x compared to standard BigQuery queries, making it an excellent investment for dashboards that need to be responsive even with large datasets.

Service Account Credentials: The Professional Way to Share Reports
When connecting BigQuery data sources, you typically have two credential options: Owner's credentials or Viewer's credentials. But BigQuery offers a third, superior option: Service Account credentials.
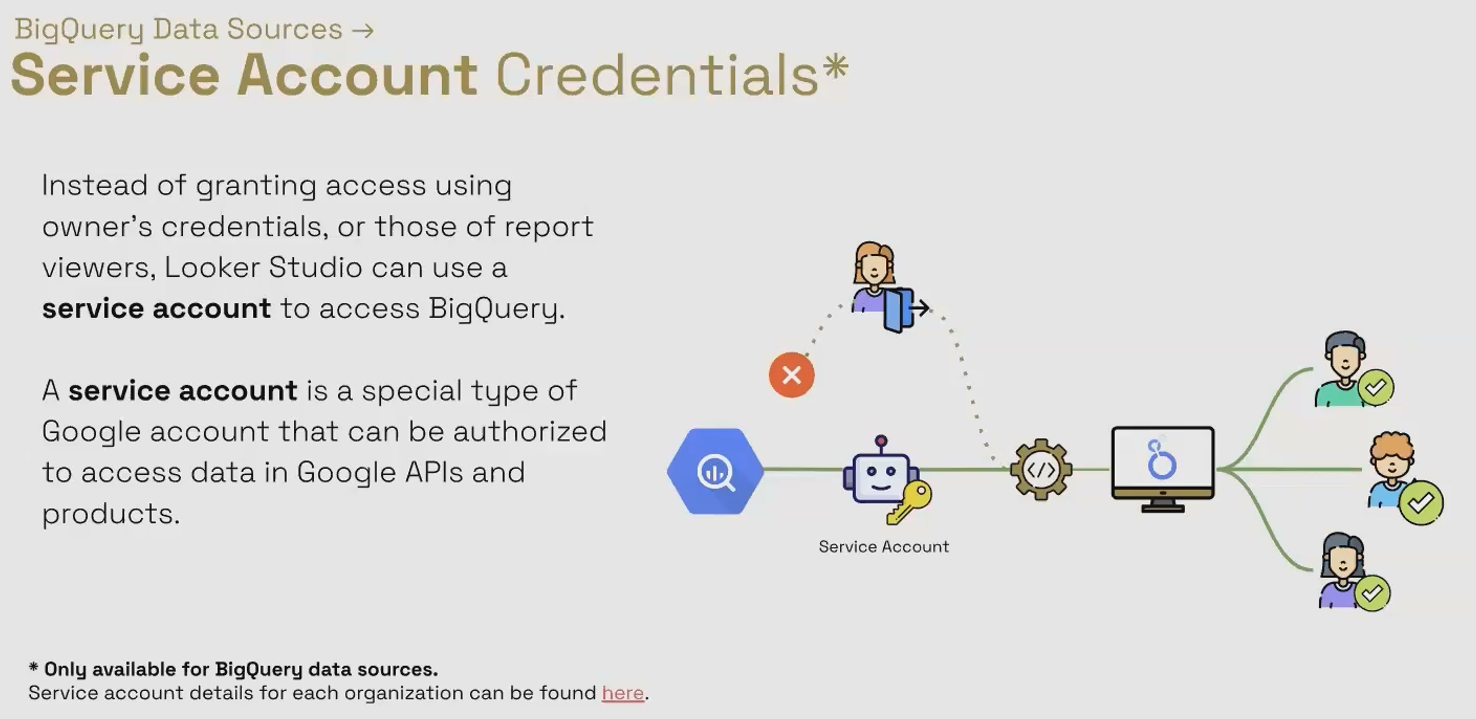
A service account is essentially a non-human Google account designed specifically for service-to-service authentication. Using a service account for your BigQuery data sources provides several advantages:
Business Continuity: Unlike using a personal account where access might be lost if someone leaves the organization, service accounts belong to the organization permanently.
Better Security: You can precisely control what the service account can access without giving it broader permissions that a human user might need.
Centralized Management: IT departments can manage service accounts according to company security policies.
Setting up a service account is straightforward:
Visit
lookerstudio.google.com/u/0/service-agent-helpto find your organization's Looker Studio service account email addressIn Google Cloud Console, grant this service account access to the specific BigQuery datasets it needs to read
In your Looker Studio BigQuery data source settings, select the service account option under credentials

Select service account credentials when setting up your BigQuery data sources for more secure and sustainable report sharing.
According to recent information from Netpeak, properly configured service accounts have become a standard best practice for enterprise-level dashboard deployments, particularly for organizations with strict data governance requirements.
Native Functions: Supercharge Your Calculated Fields
This feature truly distinguishes BigQuery from other data sources. When connected to BigQuery, Looker Studio offers access to Native Functions - a way to use BigQuery's extensive SQL function library directly in your calculated fields.
While Looker Studio has its own set of functions for calculated fields, BigQuery's SQL functions are far more extensive and powerful. The NATIVE_DIMENSION() function acts as a wrapper, allowing you to write BigQuery SQL expressions directly in your Looker Studio calculated fields.
For example, the INITCAP() function (which capitalizes the first letter of each word) doesn't exist in Looker Studio's native function set, but you can use it with a BigQuery data source:
NATIVE_DIMENSION("INITCAP(search_query)", "STRING")Other powerful examples include:
Complex hashing functions like
SHA512Advanced text analysis and NLP functions
Sophisticated date manipulations beyond Looker Studio's capabilities
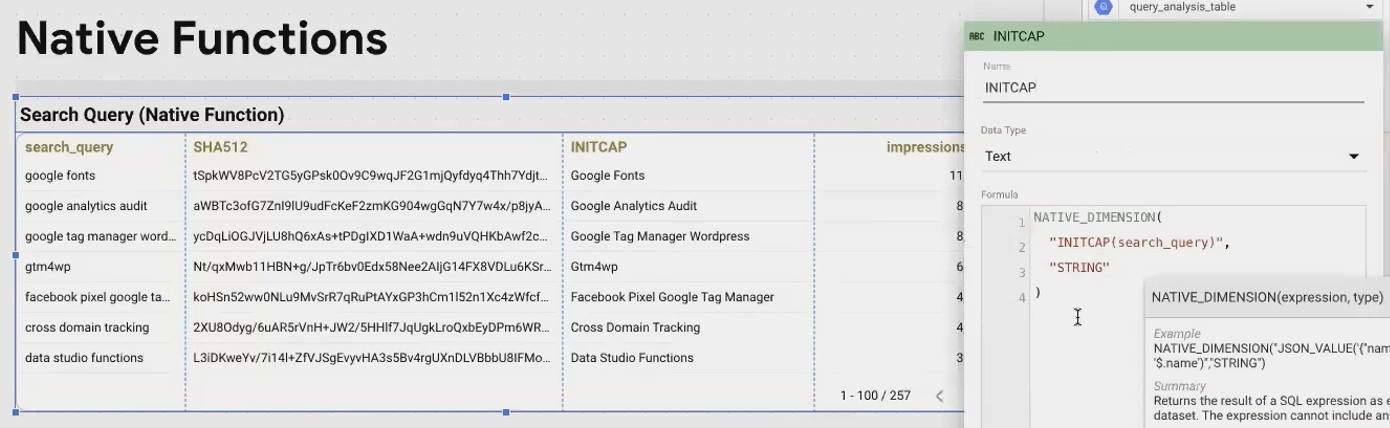
Use the NATIVE_DIMENSION function to access hundreds of BigQuery SQL functions not available in standard Looker Studio.
Important Notes About Native Functions:
They're disabled by default - you must explicitly enable them in your BigQuery data source settings
Only data source editors can create native dimension calculated fields
They only work with BigQuery data sources
The Ultimate Data Freshness Hack: 1-Minute Refreshes
Perhaps the most powerful BigQuery advantage is control over data freshness. While many connectors have fixed refresh intervals (Google Ads is locked at 12 hours, for example), BigQuery data sources can refresh as frequently as every minute.
This becomes a game-changer when you need near-real-time data in your dashboards. But the real magic happens when you combine this with a clever blending technique to boost other data sources.
The "Fake Blend" Technique
Here's a professional trick I use for clients who need fresher data than their connector allows:
Create a minimal BigQuery data source using a simple custom query like
SELECT "A" AS fake_valueSet its data freshness to 1 minute
Blend it with your primary data source (like Google Ads or Google Analytics)
Use a cross-join since you don't actually need to match any keys
Why does this work? Because blended data sources adopt the most frequent refresh setting of any constituent source. By including a 1-minute BigQuery refresh in your blend, the entire blended data source refreshes every minute!
This technique costs almost nothing to implement since the "fake" query is tiny, but it dramatically improves data freshness for sources that would otherwise be limited.
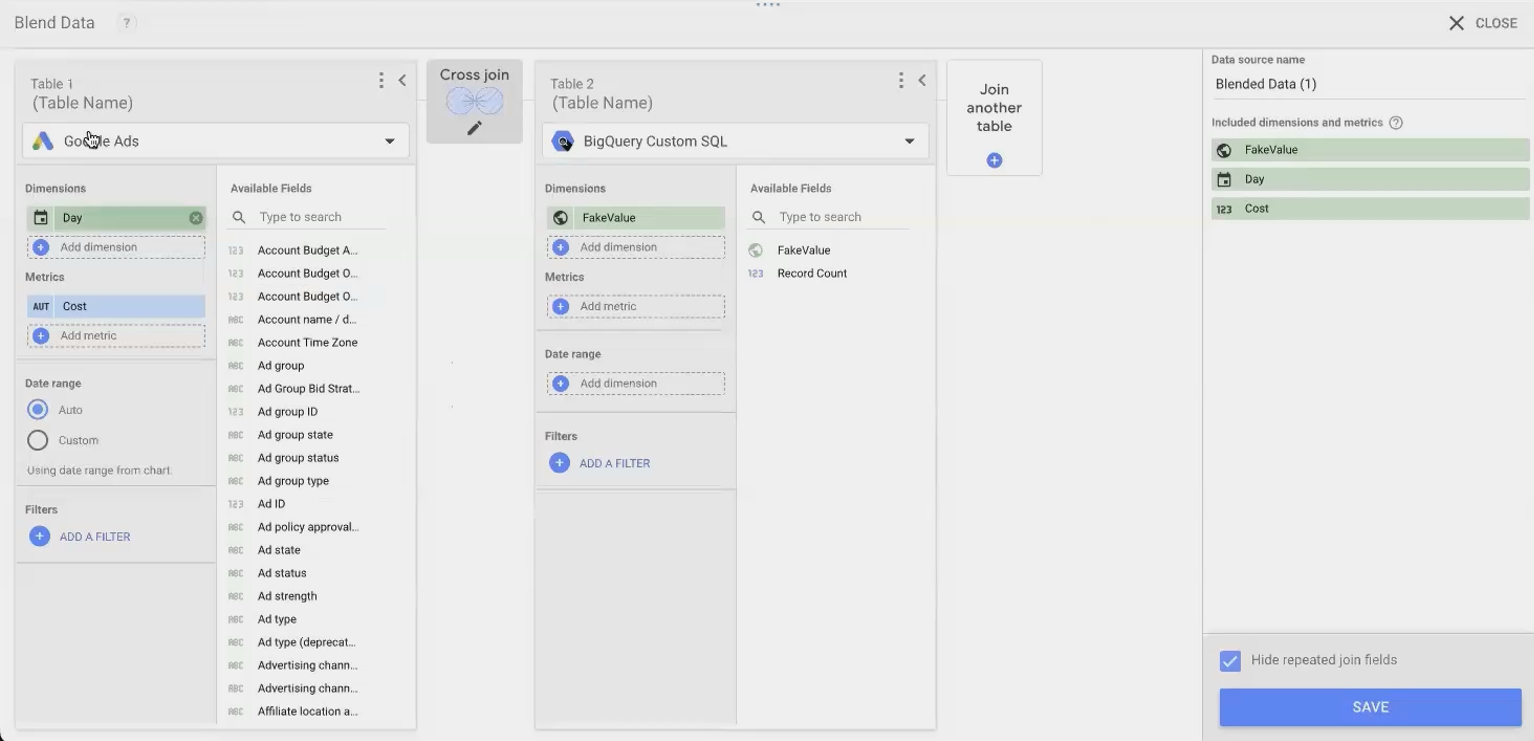
Caption: The "fake blend" technique forces other data sources to refresh as frequently as every minute.
According to a recent post from Tinybird (April 2025), this technique has become increasingly popular for creating near-real-time dashboards over BigQuery data, particularly for e-commerce and marketing analytics where timely data is critical.
Frequently Asked Questions (FAQs)
If I set my BigQuery data source to refresh every minute, will I be charged more?
Yes, potentially. BigQuery charges are based on the amount of data processed by your queries. More frequent refreshes mean more queries, which can increase costs. Monitor your usage and consider using table partitioning and clustering to reduce the amount of data scanned.
Do all viewers of my report need BigQuery access when I use service account credentials?
No, that's the beauty of service account credentials! Your viewers don't need any direct access to BigQuery. The service account handles authentication behind the scenes, allowing your viewers to see the data without requiring BigQuery permissions themselves.
Can I use native functions with blended data sources that include BigQuery?
Native functions can only be applied to fields that come directly from the BigQuery data source before blending. You cannot apply them to calculated fields created after blending or to fields from other data sources in the blend.
How can I find all charts in my report that are using a specific BigQuery data source?
Right-click on any chart that uses your BigQuery data source and select "Select charts with this data source on page." This will highlight all components on that page connected to that same data source. You'll need to repeat this process for each page in your report.
BigQuery integration truly elevates what's possible in Looker Studio. From lightning-fast queries with BI Engine to sophisticated data manipulations with native functions, these advanced features give you capabilities that simply aren't available with other data sources.
By mastering these techniques, you'll be able to create more powerful, more responsive, and more maintainable dashboards for your organization or clients. The integration between these two Google products continues to evolve, with new features regularly being added to enhance this powerful partnership.
Note:
This post is based on a subject covered in the Looker Studio Masterclass Program. To learn more about Looker Studio Masterclass, click here.