
Looker Studio Performance Optimization: How to Minimize API Requests for Lightning-Fast Reports
Have you ever shared what you thought was a perfectly designed Looker Studio report, only to have users complain about how long it takes to load? You're not alone. While we often focus on designing attractive visualizations and insightful metrics, performance optimization remains one of the most overlooked aspects of report building.
Today, we're tackling the single most effective strategy for speeding up your Looker Studio reports: reducing the number of API requests. As we'll discover, each chart on your page initiates a complex chain of communication with external data sources and these back-and-forth conversations are usually the primary culprit behind slow-loading reports.
Let's explore four powerful techniques to minimize these requests and dramatically improve your report's performance.
Why API Requests Matter: The Speed Bottleneck
Before diving into solutions, it's crucial to understand why API requests are so important. Every time a chart loads in Looker Studio, it follows a multi-step process:
The chart requests data from its data source
The data source uses a connector to query the underlying platform (like Google Analytics 4)
Looker Studio waits for the API to respond with data
Once received, the data is processed and the chart is rendered
The waiting period during step 3 is typically the longest part of this process. When you have multiple charts on a page, each making its own API requests, these delays compound quickly.
For example, a simple dashboard with five Google Analytics scorecards might be making five separate requests to the GA4 API, each one requiring its own round-trip time. This is why reducing the number of these requests is your most powerful lever for performance improvement.
Strategy 1: Break Your Report Into Multiple Pages
The simplest yet most effective approach is to distribute your charts across multiple pages rather than cramming everything onto a single dashboard.
Why This Works:
Looker Studio only loads data for the charts visible on the current page. When a user navigates to a different page, only then are the new page's charts initialized and their API requests sent. This means a 20-chart report split across four pages will initially load 5× faster than the same report on a single page.
Implementation Tips:
Organize pages logically by topic or user journey (e.g., "Acquisition Overview," "Engagement Metrics," "Conversion Analysis")
Use clear page navigation and include a table of contents on your first page
Consider your users' workflow; place the most frequently accessed information on earlier pages
Strategy 2: Replace Multiple Scorecards with a Single Table
One of my favorite optimization tricks is to replace a row of individual scorecards with a single table that has no dimensions.
How to Implement This:
Instead of creating five separate scorecards for metrics like Sessions, Users, Pageviews, Bounce Rate, and Conversion Rate
Create one table with no dimension (just the metrics as columns)
This results in a single-row table showing all five metrics
Style the table to remove borders and match your design aesthetic
The Technical Advantage:
The five scorecards would generate five separate API requests, while the table generates just one request that fetches all five metrics simultaneously. For Google Analytics data especially, this significantly reduces loading time while displaying identical information.
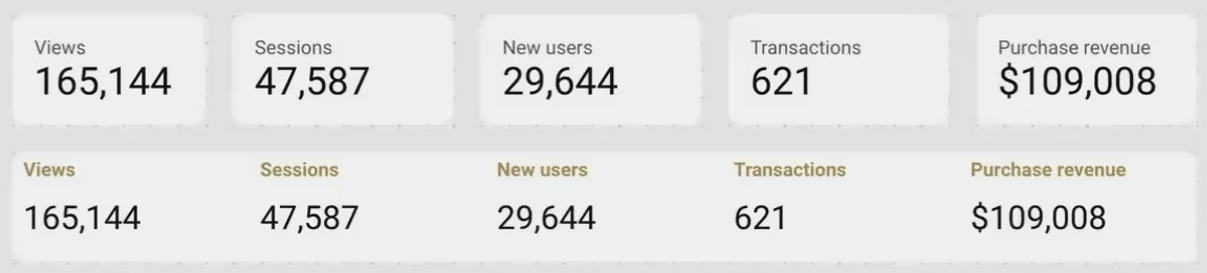
One API request instead of five: A table with no dimensions can replace multiple scorecards while maintaining a clean look.
Strategy 3: Leverage Optional Metrics for Time-Series and Comparison Charts
Rather than creating separate charts for related metrics, use Looker Studio's optional metrics feature to let users toggle between different data points in a single chart.
Implementation Steps:
Create a single time series, bar chart, or other visualization
Add your primary metric (e.g., "Sessions")
In the chart's Data tab, click "Add Metric" to add additional metrics (e.g., "Users," "Pageviews")
In the Style tab, enable "Optional metrics" and "Show in header"
This creates a small dropdown in the chart header that lets users switch between metrics without requiring Looker Studio to load all metrics simultaneously.
Best Practices:
Group metrics that have similar scales and units (mixing pageviews with conversion rates in the same chart can create scaling issues)
Limit optional metrics to 3-5 related items for the best user experience
If you need precise control over colors and formatting for each series, configure these in the Style tab before making them optional
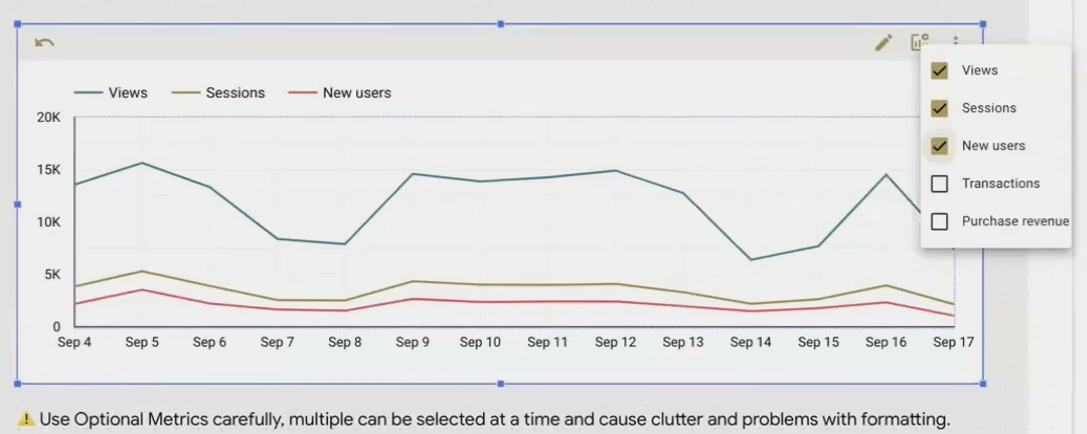
Optional metrics let users explore different data points without multiple API requests loading simultaneously.
Strategy 4: Use Caching to Your Advantage
Looker Studio's data freshness settings allow you to cache query results for a specified period, dramatically reducing load times for frequent report viewers.
How Caching Works:
When a viewer loads your report with a specific configuration of date ranges and filters, Looker Studio queries the data source and stores (caches) the results. If another viewer (or the same viewer) loads the report with identical settings within your caching period, Looker Studio serves the cached data instead of making new API requests.
Optimization Steps:
Edit your data source and find the "Data freshness" setting
Choose an appropriate caching period based on how frequently your data updates and how current it needs to be
For daily reporting, 12 hours (the default) is often sufficient
For real-time dashboards, you might need to reduce this to 15 minutes
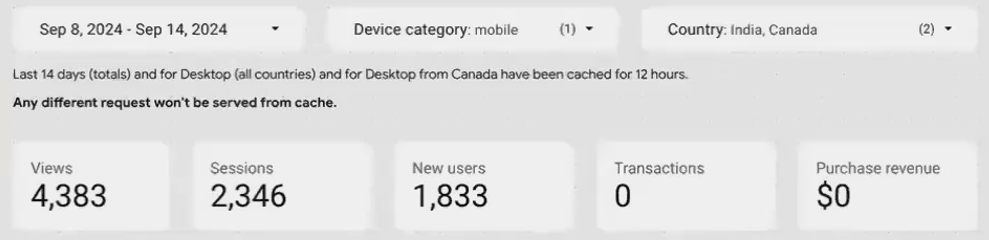
Setting an appropriate caching period balances performance with data freshness needs.
Pro Tip:
To maximize the benefits of caching, design your reports with a limited set of predefined filter options (like dropdown selectors) rather than open text filters. This increases the likelihood that users will select the same filter combinations, allowing them to benefit from cached results.
Frequently Asked Questions (FAQs)
How many charts per page is considered "too many"?
While there's no hard limit, performance typically begins to degrade noticeably with more than 8-10 complex charts on a single page. However, this varies based on factors like data source responsiveness and query complexity. A better approach than counting charts is to monitor the actual load time. If a page takes more than 3-5 seconds to load, consider breaking it into multiple pages.
Does using multiple data sources on one page affect performance?
Yes. Each data source potentially represents a separate connection to an external API. If you have five charts using five different data sources, that's five separate connection processes. Where possible, consolidate multiple data sources by using data blending or by warehousing your data in a single source like BigQuery.
Do filter controls count as "charts" that make API requests?
Yes and no. Filter controls themselves don't directly query your data source, but they do cause connected charts to refresh with new queries when users interact with them. To optimize performance, limit the number of filter controls and connect them only to the charts that absolutely need them.
Will reducing API requests affect data freshness?
Some optimization techniques (like caching) do involve a trade-off with data freshness. However, strategies like using tables instead of multiple scorecards or breaking reports into pages don't affect freshness at all. They simply make the data retrieval process more efficient.
Do "Extract Data" sources count toward API request limitations?
No. Once you've created an Extract Data source, it becomes a self-contained dataset within Looker Studio's infrastructure. Charts using this extracted data don't make additional calls to the original API, which is why Extract Data can be a powerful performance optimization technique for frequently viewed reports.
Reducing API requests is the single most effective way to improve Looker Studio report performance. By implementing the strategies we've discussed (breaking reports into pages, consolidating scorecards into tables, using optional metrics, and leveraging caching) you can dramatically reduce load times without sacrificing analytical depth.
Remember that performance optimization is always a balancing act. While a lightning-fast report is ideal, make sure your optimizations don't compromise the insights and interactivity your users need. With thoughtful application of these techniques, you can create reports that are both insightful and responsive.
Note:
This post is based on a subject covered in the Looker Studio Masterclass Program. To learn more about Looker Studio Masterclass, click here.