
Looker Studio Numeric Calculations & Calculated Fields
Data transformation is the backbone of any powerful report in Looker Studio. While connecting data sources is the first step, knowing how to extract meaningful insights through calculations is where the real magic happens. In this post, we'll explore essential techniques for numeric calculations, mathematical operations, and the strategic placement of your calculated fields.
If you've been struggling with getting your metrics right or wondering why your formulas don't work as expected, you're in the right place. Let's dive into the mechanics that will elevate your Looker Studio reports from basic to brilliant!
Turning Dimensions into Metrics: COUNT & COUNT_DISTINCT
One of the most powerful data transformations in Looker Studio is the ability to generate metrics from dimensions. While dimensions like product names, dates, or categories are typically used for organizing data, they can also tell us valuable quantitative stories.
What Can You Count?
Imagine your client asks questions like:
"How many unique products did we sell last month?"
"From how many different brands did we make sales?"
"Across how many days did we have transactions?"
These questions don't directly match the metrics in your dataset, but Looker Studio provides elegant solutions through the COUNT and COUNT_DISTINCT functions.
Simple Counting with Scorecards
The easiest way to count unique values from a dimension is to add it directly to a scorecard:
Create a new scorecard
Instead of selecting a metric (blue field), select a dimension (green field)
Looker Studio automatically applies
COUNT_DISTINCTto give you the unique count
For example, adding the "Date" dimension to a scorecard might show "28" - indicating your data spans 28 unique days. Similarly, adding "Product" might show "447" - revealing you sold 447 different products.
Advanced Counting with Calculated Fields
For more complex counting scenarios, you can create calculated fields using formulas. Here's a practical example:
If you want to count unique combinations of brand and product name (for instance, to identify unique SKUs), you can use:
COUNT_DISTINCT(CONCAT(Item_Brand, Item_Name))This formula first concatenates (joins) the brand and product name for each row, then counts the unique combinations.
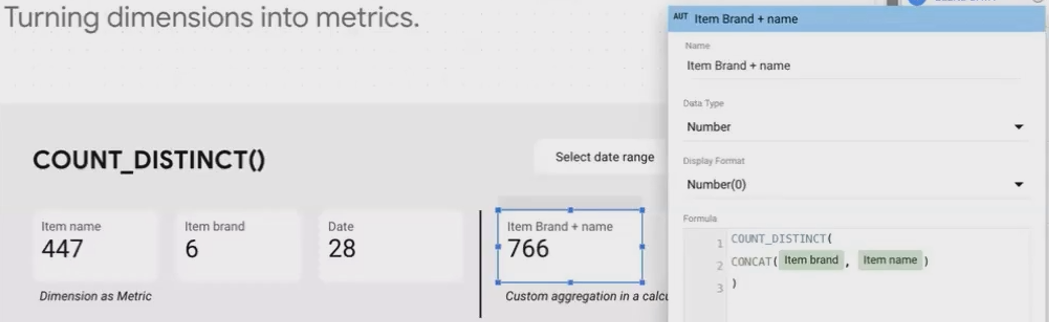
Distinct Count of “Item Brand + Item Name”
Counting Time Periods
Dates are especially useful for analytical counting. To count the number of weeks in your dataset:
COUNT_DISTINCT(FORMAT_DATETIME("%Y-%W", Date))This formula formats each date to show the year and week number (like "2024-01" for Week 1 of 2024), then counts the distinct values. If your 28 days span across 5 weeks, you'll get the value "5".
Mathematical Operators: Building Complex Metrics
Once you've mastered counting, it's time to unleash the full power of mathematical operations in Looker Studio. These operations allow you to create custom metrics that perfectly match your business needs.
Basic Operators
Looker Studio supports all standard mathematical operators:
Addition (+)
Subtraction (-)
Multiplication (*)
Division (/)
You can combine these with parentheses to control the order of operations, just like in spreadsheets or programming languages.
Creating Profit Calculations
A common business metric is profit, which typically involves revenue minus various costs. Here's how to create a comprehensive profit calculation:
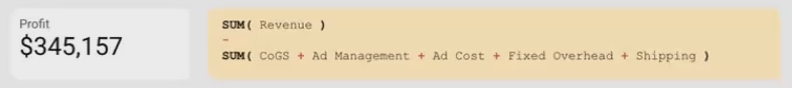
Calculating Profit
This formula:
Adds up all your costs (Cost of Goods Sold, Shipping, Overhead, Ad Management, Ad Spend)
Subtracts the total cost from your total revenue
Returns your profit figure
Average Metrics Over Time Periods
Want to see your average monthly ad spend? You'll need to:
Calculate the total ad spend
Determine how many months are in your dataset
Divide the total by the number of months

Calculating Avg. Monthly Ad Spend
This formula first formats each date to show year and month (like "202311" for November 2023), counts how many unique months appear, then divides your total ad spend by that number.
The Power of Parentheses
Parentheses aren't just for controlling calculation order, they're essential for creating clear, maintainable formulas. Compare these two approaches:
Without parentheses (harder to read):
SUM(Revenue) - SUM(COGS) - SUM(Shipping) - SUM(Overhead) - SUM(AdManagement) - SUM(AdSpend)With parentheses (clearer structure):
SUM(Revenue) - (SUM(COGS) + SUM(Shipping) + SUM(Overhead) + SUM(AdManagement) + SUM(AdSpend))Both calculate the same result, but the second version makes it immediately clear that you're subtracting the sum of all costs from revenue.
The Strategic Choice: Chart-Level vs. Data Source-Level Fields
Where you create your calculated fields in Looker Studio matters tremendously. This choice affects reusability, maintenance, and even the functionality of your reports.
Two Approaches to Calculated Fields
Looker Studio offers two places to create calculated fields:
Chart-Level Fields: Created directly within a specific chart or visualization
Data Source-Level Fields: Created in the data source itself, available to all charts
Each approach has distinct advantages and limitations that impact your workflow.
Chart-Level Calculated Fields: Quick but Limited
Chart-level fields are created by:
Selecting a chart
Clicking on "Add a metric"
Choosing "Create field"
Entering your formula
Advantages:
Quick to implement for one-off calculations
Isolated from other charts (changes won't affect anything else)
Perfect for chart-specific metrics that aren't needed elsewhere
Limitations:
Only available in the specific chart where created
Cannot be referenced by other calculated fields
Cannot be used in filters or controls
Must be recreated in every chart that needs the same calculation
Formatting must be set individually for each instance
Data Source-Level Fields: Powerful and Reusable
Data source-level fields are created by:
Going to "Resource" > "Manage added data sources"
Selecting "Edit" for your data source
Clicking "Add a field"
Entering your formula
Alternatively, you can use the "Add a field" button in the data panel sidebar.
Advantages:
Available to all charts and components using that data source
Can be referenced in other calculated fields
Can be used in filters and controls
Created once, used many times
Central management—edit in one place, changes reflect everywhere
Consistent formatting across all instances
Limitations:
Takes slightly longer to create initially
Changes affect all charts using the field (which could be unintended)
Practical Example: Managing Business Costs
Let's say you frequently calculate total costs across various reports. You could:
Option 1: Chart-Level Approach
Create this formula in every chart that needs it:
SUM(COGS) + SUM(Shipping) + SUM(Overhead) + SUM(AdManagement) + SUM(AdSpend)Option 2: Data Source-Level Approach
Create a "Total_Cost" field once in your data source with the same formula.
Now, imagine your business adds a new cost category. With the chart-level approach, you'd need to edit every single chart formula. With the data source-level approach, you make one edit that automatically updates everywhere.
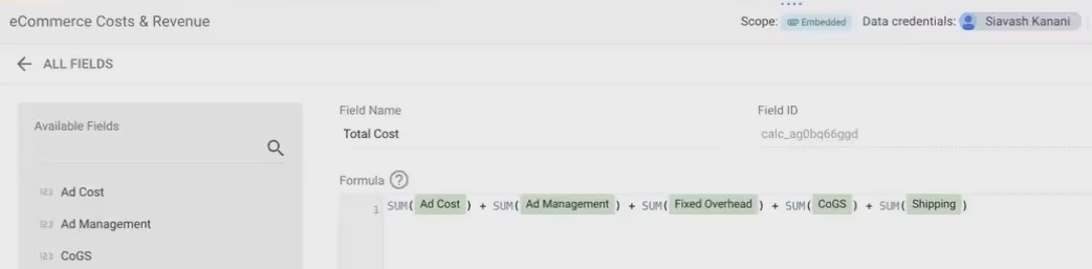
Creating Total Cost in Data Source to use repeatedly
Best Practice Recommendation
For metrics that you'll use repeatedly or that represent standard business calculations (like profit, conversion rate, or cost per acquisition), always create them at the data source level. This approach:
Ensures consistency across your reports
Saves time in the long run
Reduces errors from formula discrepancies
Makes your reports more maintainable
Reserve chart-level calculations for truly one-off metrics or experimental calculations that you don't need elsewhere.
Frequently Asked Questions (FAQs)
I'm not great with formula syntax. How can I improve my skills with Looker Studio formulas?
Learning formula syntax takes practice, but there are several ways to build your skills:
Study the [official Looker Studio function reference](https://support.google.com/looker-studio/table/6379764?hl=en)
Practice in Google Sheets first, as many formulas work similarly
Start with simple formulas and gradually build complexity
Join online communities where you can ask for help with specific formulas
Break down complex formulas into smaller parts to understand each component
When duplicating a report for another client, should I use chart-level or data source-level calculated fields?
For client templates, the best approach is:
First duplicate your reusable data source that contains all your calculated fields
Update the duplicated data source to connect to the new client's data
Then duplicate your report and connect it to the new data source
This way, you maintain all your data source-level calculated fields while creating a separate instance for each client. This prevents changes for one client from affecting others.
Can I use window functions like in SQL within Looker Studio?
No, Looker Studio doesn't support window functions directly. It's limited to group-by-style aggregations (SUM, AVG, MIN, MAX, etc.). For advanced window functions, you'll need to:
Perform those calculations in your data source (like BigQuery)
Then bring the results into Looker Studio
What's the difference between using DATE_DIFF and COUNT_DISTINCT for date calculations?
These functions serve different purposes:
DATE_DIFFcalculates the time span between two dates (e.g., 15 days between Jan 1 and Jan 15)COUNT_DISTINCTcounts unique date values (e.g., 2 distinct dates if you only have Jan 1 and Jan 15 in your dataset)
Use DATE_DIFF when you need the actual time span, and COUNT_DISTINCT when you need to know how many unique dates appear in your data.
Is it possible to aggregate through a window function in Looker Studio?
No, Looker Studio doesn't support window functions like SQL's OVER() clause. For advanced analytics requiring window functions, pre-process your data in BigQuery or another database system that supports these operations, then bring the results into Looker Studio.
Mastering numeric calculations and understanding the strategic importance of field placement are fundamental skills for creating powerful, maintainable Looker Studio reports. By leveraging COUNT and COUNT_DISTINCT functions, applying mathematical operators effectively, and making smart choices about where to create your calculated fields, you'll build reports that are both insightful and sustainable.
Remember that good data visualization starts with good data transformation. The techniques we've explored today form the foundation upon which you can build more complex analyses and compelling visual stories with your data.
As you continue your Looker Studio journey, experiment with these concepts using your own datasets. You'll find that understanding these fundamentals makes even the most complex reporting challenges more approachable.
Note:
This post is based on a subject covered in the Looker Studio Masterclass Program. To learn more about Looker Studio Masterclass, click here.