
Looker Studio Aggregation: Calculations, Ratios & Auto-Agg Explained
Have you ever created a Looker Studio report that seemed perfect, only to discover that your metrics don't add up correctly? Or wondered why your calculated ratios look suspicious when compared to your raw data? If so, you're not alone.
Today, we're diving into the foundation of effective data visualization in Looker Studio: aggregation and numeric calculations. While this might sound dry at first glance, understanding these concepts will save you hours of troubleshooting and enable you to create reports that are both accurate and insightful.
As we explore the intermediate level of Looker Studio mastery, we'll focus on four main types of data transformation:
Aggregation - The process of reducing and summarizing data
Calculated Fields - Creating new metrics from existing ones
Data Blending - Combining different data sources
Parameters - Adding dynamic inputs to your reports
Today, we'll focus primarily on aggregation and numeric calculations, which represent about 90% of the data transformation work you'll do in Looker Studio. Let's unlock these powerful concepts!
Understanding Aggregation: The Art of Summarizing Data
What Exactly is Aggregation?
At its core, aggregation is simply the process of reducing multiple data points into a single value. But this seemingly simple concept is often the source of confusion in data reporting.
Let's consider a practical example. Imagine you have sales data for the first week of January, and someone asks you: "What were the sales in the first week of January?"
If you have the following daily sales figures:
January 1: $5
January 2: $8
January 3: $18
January 4: $3
January 5: $11
January 6: $6
January 7: $14
What's your answer to "What were the sales?"
Most people would sum these values and say $65. But that's just one way to aggregate this data. Depending on what the person actually wants to know, the correct answer could be:
$65 (SUM of all sales)
$9.30 (AVERAGE sales per day)
$3 (MINIMUM daily sales)
$18 (MAXIMUM daily sales)
7 (COUNT of sales entries)
Each of these is a valid aggregation method that reduces our seven data points to a single value.
Common Aggregation Methods in Looker Studio
Looker Studio offers several aggregation methods for your metrics:
SUM: Adds all values together
AVERAGE: Calculates the mean of all values
MINIMUM: Returns the lowest value
MAXIMUM: Returns the highest value
COUNT: Returns the number of values
COUNT DISTINCT: Returns the number of unique values
AUTO: Special aggregation determined by the data source or formula
NONE: Used for dimensions where aggregation doesn't apply
The Critical Distinction: Aggregation vs. Calculation
One of the most important concepts to understand is the difference between aggregation and calculation:
Aggregation happens vertically in a table: It reduces multiple values in a single column to one value (e.g., summing all sales figures).
Calculation happens horizontally across a row: It combines values from different columns to create a new value (e.g., subtracting Cost from Revenue to get Profit).
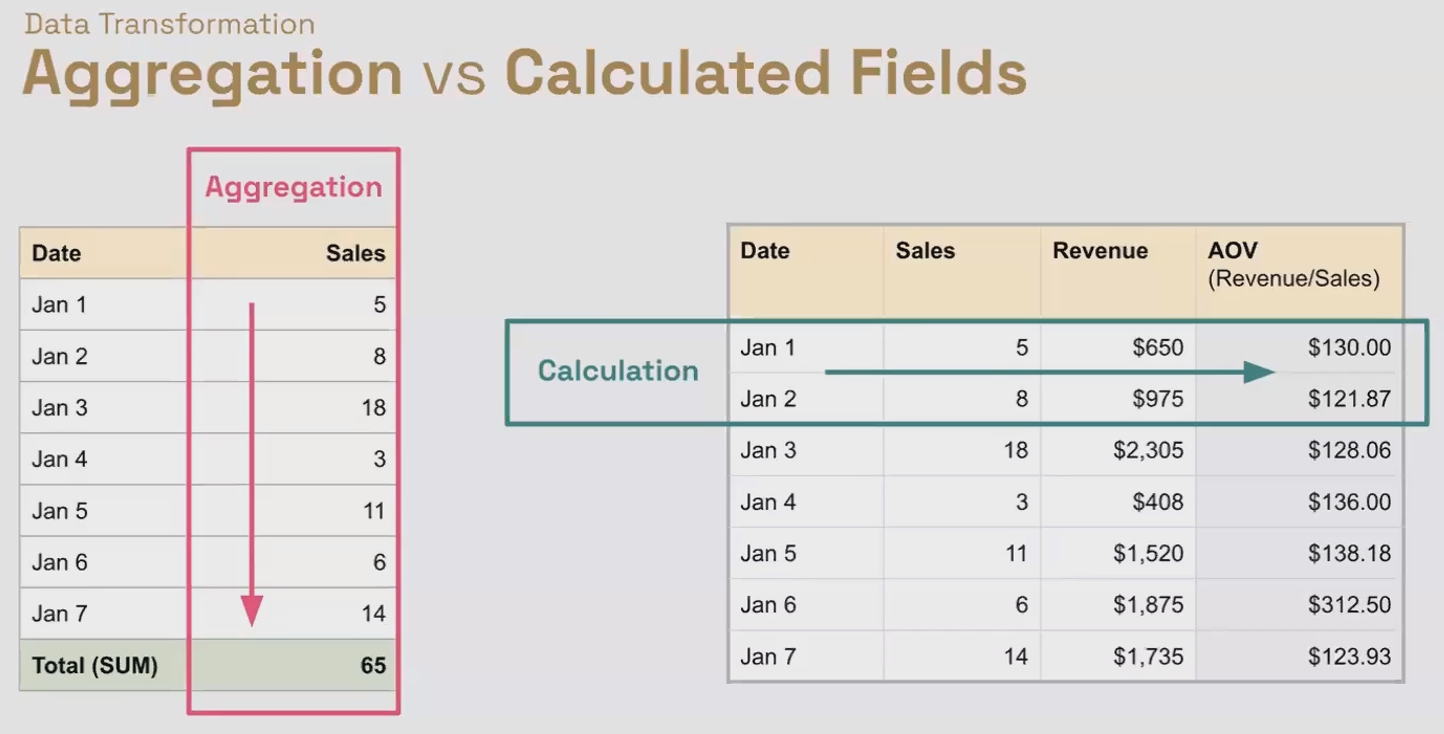
Aggregation vs Calculated Fields
This distinction is fundamental to understanding how Looker Studio processes your data:
You can also have aggregated calculations, where you first calculate new values across rows, then aggregate those calculated values (e.g., calculating profit margin for each transaction, then finding the average profit margin).
The Importance of De-Aggregation: Breaking Down to Build Up
Why We Need to De-Aggregate Data
When working with data sources like Google Analytics or Google Ads, you often receive pre-aggregated data. For example, Google Analytics might provide you with the total number of transactions (65) for a given period.
If you want to apply a different aggregation method (such as finding the average daily transactions) you first need to break down (de-aggregate) that total by a dimension like Date.
Now you can calculate the average (9.3 transactions per day), minimum (5), or maximum (12).
The Impact of Different Breakdown Dimensions
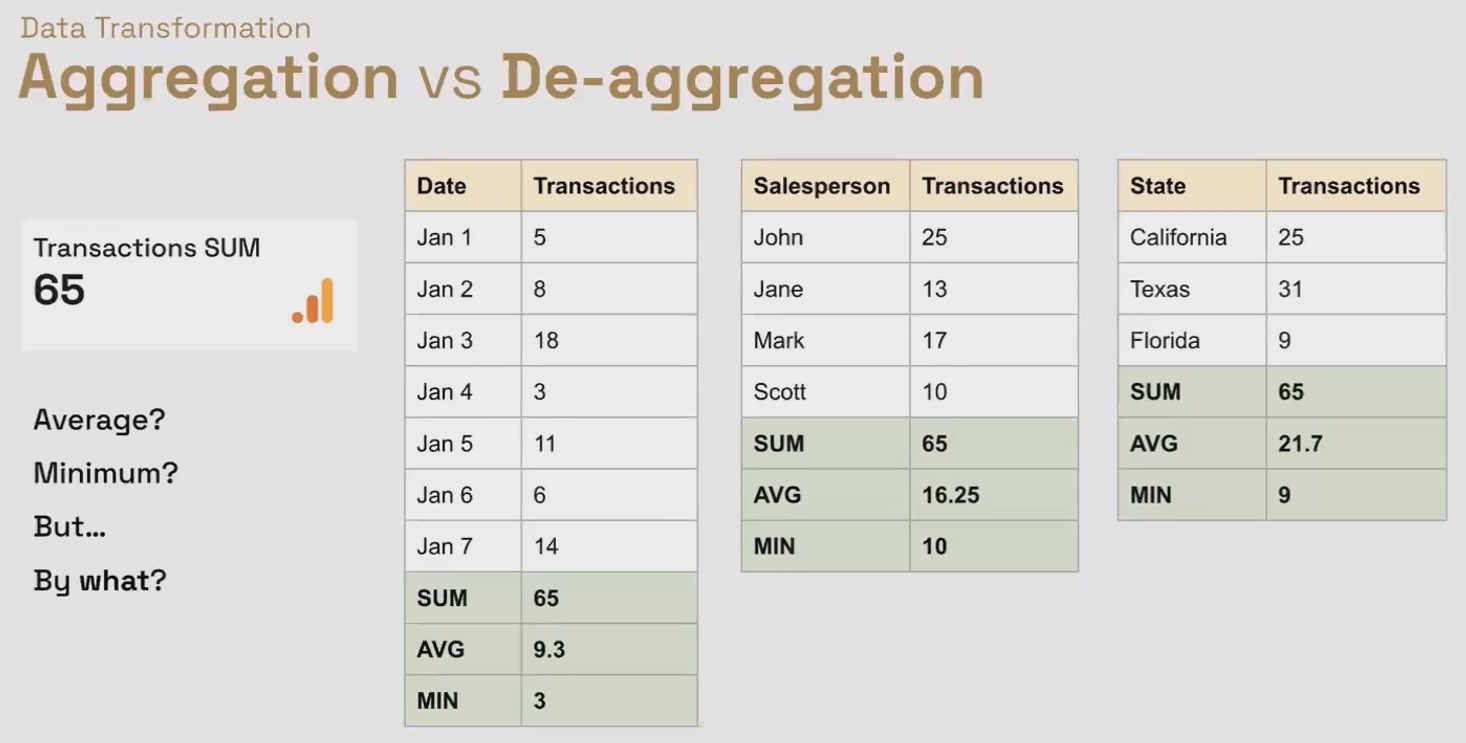
The dimension you choose for de-aggregation significantly impacts your aggregated results (except for SUM, which remains constant).
For example, if we break down the same 65 transactions by salesperson instead of date, now our average is 16.25 transactions per salesperson (not 9.3 per day), and our minimum is 10 (not 3).
Similarly, if we break down by state or product category, we'll get different averages, minimums, and maximums – while the sum remains 65.
Total Aggregation: Summarizing Your Entire Dataset
Let's apply these concepts to a simple dataset of digital product sales, which includes:
Month (January to April)
Product (Ebook, Workshop, Course)
Number of Sales
Landing Page Views
Revenue
Cost of Goods Sold
Ad Spend
Creating Aggregated Scorecards
When you add a scorecard to your report and connect it to a numeric field like "Sales," Looker Studio automatically applies the default aggregation method (typically SUM). This gives you the total sales across your entire dataset.
You can change this aggregation method by editing the metric properties:
Click on the scorecard
In the Data panel, click on the metric being used
Change the aggregation method from the dropdown (SUM, AVERAGE, MIN, MAX, etc.)
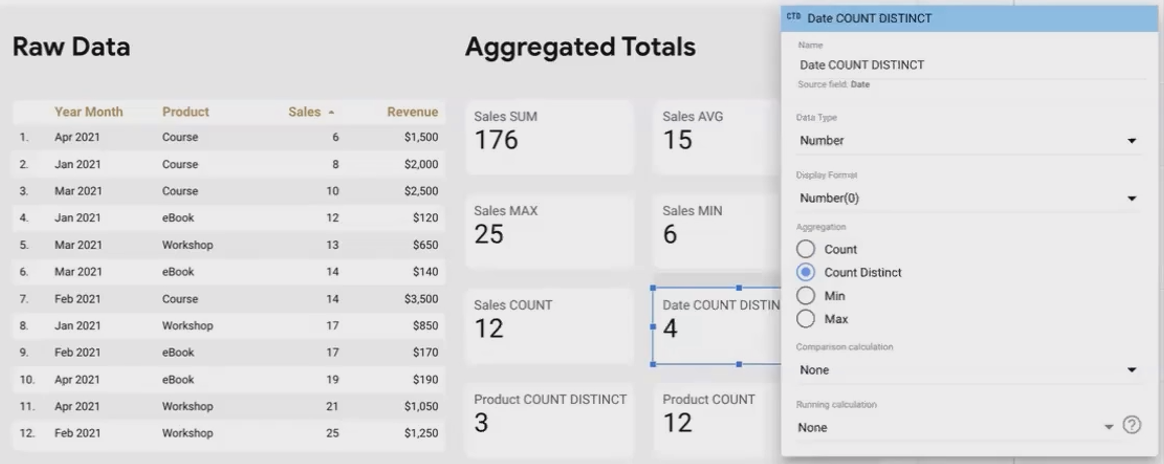
Changing the Aggregation Method
When changing from the default aggregation method, it's good practice to clearly indicate this in your scorecard title or description (e.g., "Average Sales per Month" instead of just "Sales").
Per Category Aggregation: Group-Level Insights
While total aggregation summarizes your entire dataset, per-category aggregation breaks down your metrics by one or more dimensions.
Creating Tables with Per-Category Aggregation
When you add dimensions to a table alongside metrics, Looker Studio automatically groups and aggregates your data by those dimensions:

Each row shows the aggregated values for that specific product across all months. The aggregation happens at the category level – in this case, the Product level.
If you add a summary row to your table, it will follow the same aggregation method as each column. For example:
For "Sum of Revenue," the summary row will sum all values
For "Average of Revenue," it will average all values across the entire dataset, not just the category averages
Drilling Down with Multiple Dimensions
You can add multiple dimensions to see more granular aggregations. For example, adding both Product and Date:
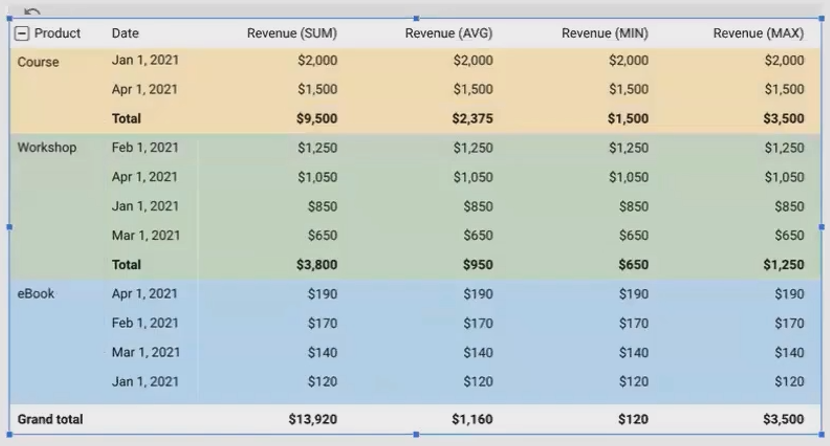
This approach allows you to see how metrics perform across different category combinations while still benefiting from appropriate aggregation.
Aggregating Ratios: The Right and Wrong Way
One of the most common pitfalls in Looker Studio is incorrectly aggregating ratios or calculated metrics. Let's see why this happens and how to fix it.
The Problem with Simple Division
Imagine you want to calculate "Revenue per Landing Page View" from our digital products dataset. You might create a calculated field with:
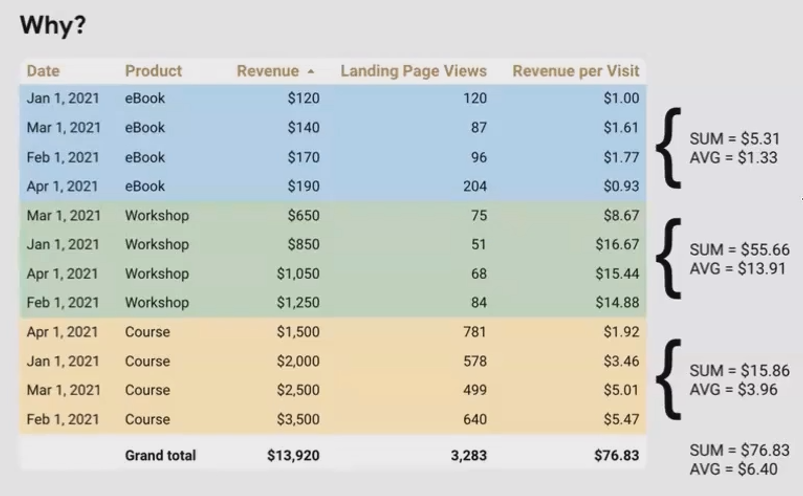
Revenue / Landing Page ViewsThis seems logical, but when applied to a scorecard, you'll get approximately $76.83, which is likely incorrect!
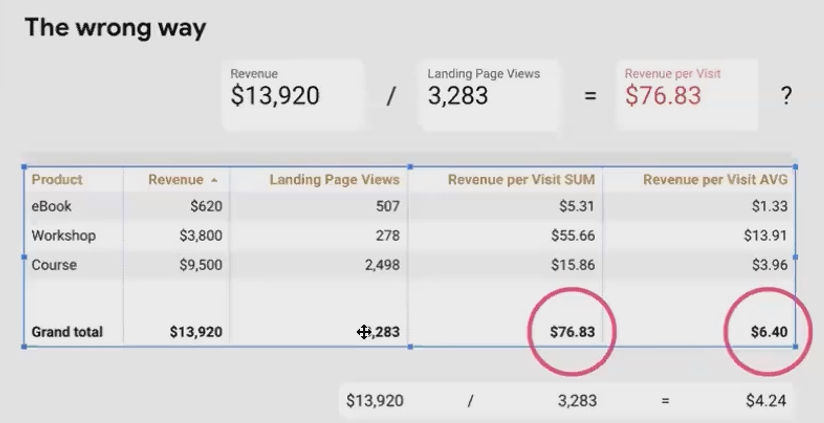
Here's why: Looker Studio first calculates this ratio for each row in your dataset, then aggregates (sums) those individual ratios. But that's not the same as dividing the total revenue by the total landing page views.
The Right Way: Aggregate Then Calculate
The correct approach for ratio metrics is to aggregate the components first, then perform the calculation:
SUM(Revenue) / SUM(Landing Page Views)This formula tells Looker Studio to:
Sum all revenue values
Sum all landing page views
Divide the first sum by the second sum
The result is approximately $4.24 per landing page view – significantly different from our first calculation!
This approach works correctly at all levels:
At the row level (individual data points)
At the category level (e.g., per product)
At the total level (entire dataset)
When you use this "aggregate first, then calculate" approach, Looker Studio automatically sets the aggregation method to "Auto" and doesn't allow you to change it. This is because the aggregation logic is built into your formula.

Auto Aggregation: When Looker Studio Decides
Auto aggregation occurs in two main scenarios in Looker Studio, and understanding both will help you avoid frustration when building reports.
Scenario 1: Auto Aggregation Set by the Data Source
Some data sources, particularly Google Analytics and Google Ads, provide pre-aggregated metrics through their APIs. For example, when you request "Total Revenue" from GA4, you receive a single, already-aggregated number.
In these cases:
The aggregation method is set to "Auto"
You cannot change the aggregation method in Looker Studio
You cannot apply a different aggregation (like AVERAGE or MIN) to these metrics
This happens because Looker Studio doesn't have access to the individual transactions that make up that total – only to the final aggregated value.
If you need to analyze these metrics with different aggregation methods, you'll need to:
Break down the metric by dimensions (like Date, Product, etc.) in a table
Consider using data extraction or data blending techniques (covered in future blogs)
Export the data to BigQuery where you can access more granular information
Scenario 2: Auto Aggregation Set by Calculated Fields
As we saw with our ratio example, when you create calculated fields using aggregation functions (like SUM(Revenue) / SUM(Landing Page Views)), the aggregation method is automatically set to "Auto."
This happens because:
The formula itself defines how aggregation should happen
Any other aggregation method would conflict with the formula's built-in logic
Looker Studio recognizes this and enforces "Auto" aggregation
Auto-aggregated calculated fields work correctly at all levels (row, category, and total) without requiring additional configuration.
Frequently Asked Questions (FAQs)
Can I create percentages or ratios in Looker Studio that aggregate correctly?
Yes! Always use the pattern SUM(Numerator) / SUM(Denominator) for ratios that need to be aggregated. For example, to calculate click-through rate:
SUM(Clicks) / SUM(Impressions)Then format the result as a percentage in the metric settings.
Can I apply different aggregation methods (like AVERAGE or MIN) to metrics from Google Analytics?
Not directly with pre-aggregated metrics. GA4 and Universal Analytics provide already-aggregated metrics through their API connections. To apply different aggregation methods, you need to:
Break down the data by a dimension like Date in a table
Use data extraction techniques
Use data blending (self-blending)
Or connect to the raw data in BigQuery (for GA4)
How do I visualize Google Ads data broken down by geography (like zip code) and search terms?
First determine if this data is available through the Google Ads connector. If it is, create a table with:
Zip Code as the primary dimension
Search Term as a secondary dimension
Clicks and Impressions as metrics
You can then create a map chart using the geographical data and use color or size to represent metrics like CTR (Click-Through Rate).
What's the difference between DATE_DIFF and COUNT_DISTINCT for analyzing date ranges?
They serve different purposes:
DATE_DIFFcalculates the actual time span between two dates (e.g., 15 days between Jan 1 and Jan 15)COUNT_DISTINCTcounts the number of unique date values in your dataset (e.g., 2 unique dates if you only have Jan 1 and Jan 15 in your data)
Use DATE_DIFF when you need the actual duration, and COUNT_DISTINCT when you need to know how many different dates appear in your data.
Understanding aggregation and numeric calculations is fundamental to creating accurate and insightful reports in Looker Studio. By mastering these concepts, you'll:
Avoid common pitfalls with ratios and calculated metrics
Know when and how to properly aggregate your data
Understand the limitations of different data sources
Create more accurate and reliable reports
Remember the key principles:
Aggregation reduces multiple values to a single value
Different aggregation methods (SUM, AVERAGE, MIN, MAX) tell different stories
For ratios, always aggregate first, then calculate:
SUM(X) / SUM(Y)Be aware of auto-aggregated metrics from sources like Google Analytics
With these foundations in place, you're well on your way to becoming a Looker Studio master!
Note:
This post is based on a subject covered in the Looker Studio Masterclass Program. To learn more about Looker Studio Masterclass, click here.