
Looker Studio Data Blending: A Guide to Left vs. Inner Joins
Welcome to the advanced track of Looker Studio! We've already covered the essentials and most intermediate concepts. Now we're diving into some truly advanced territory with data blending join types. This session builds on our previous data transformation discussions but takes us deeper into the mechanics of how different join types work and when to use them.
Why is this important? Because in the real world of data analysis, your data rarely comes from a single, perfectly formatted source. Understanding how to properly blend multiple data sources can unlock powerful insights that would otherwise remain hidden.
Let's get started!
Why We Need Data Blending
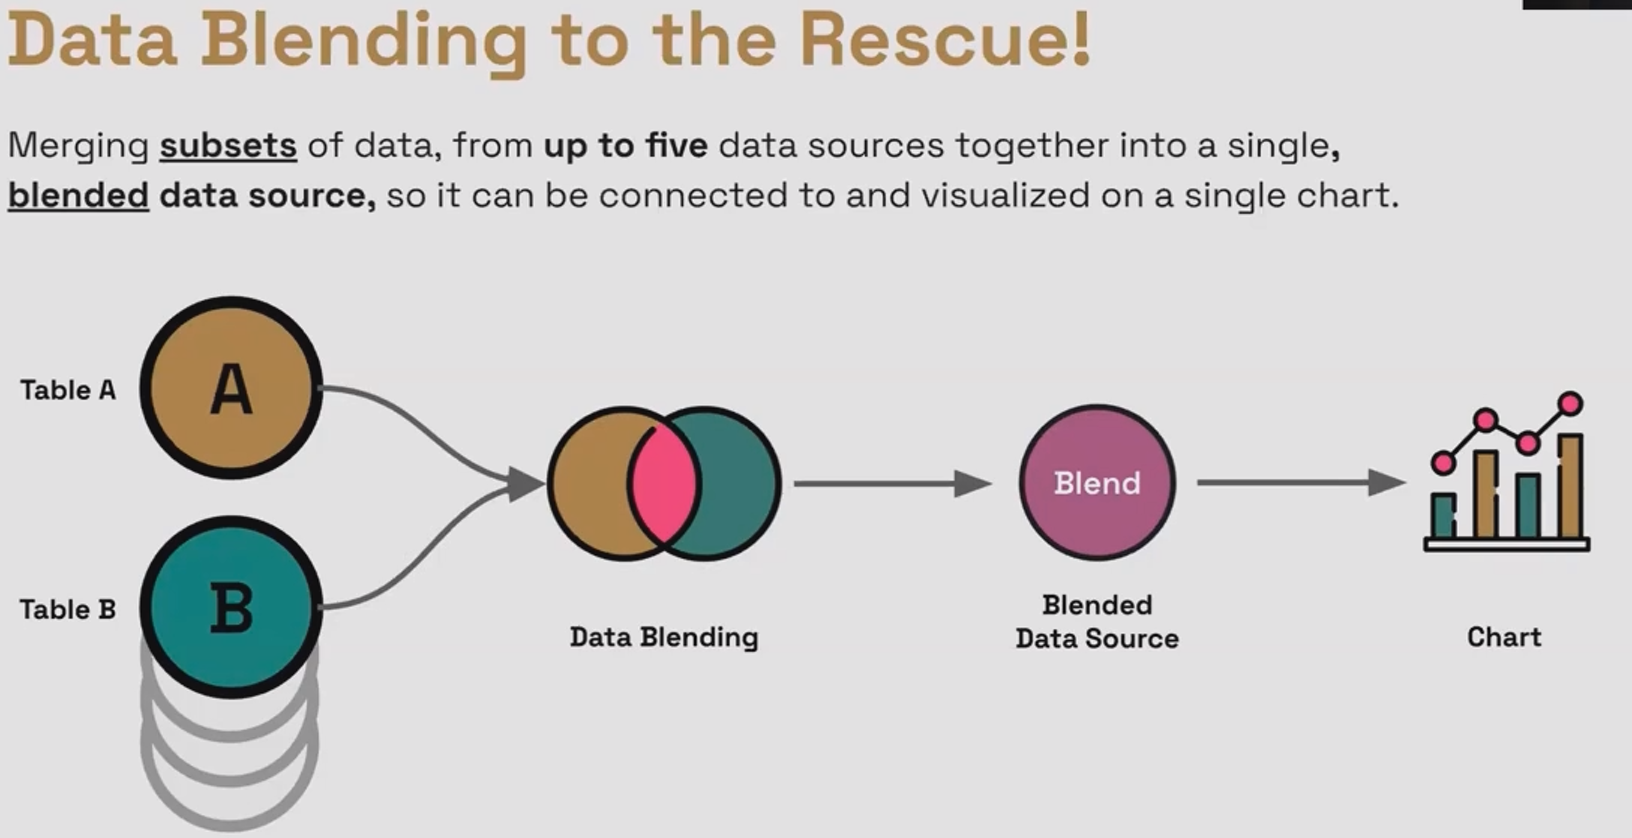
In Looker Studio, there's one fundamental rule you can't break: one chart can only be connected to one data source. Period. So what happens when your analysis requires data from multiple sources? That's where data blending comes in.
Data blending allows you to:
Merge data from up to five different data sources into a single blended data source
Connect this new blended data source to your charts
Apply different join types to control exactly how your data is combined
Think of data blending as creating a "super dataset" that draws from multiple sources but appears to Looker Studio as a single data source.
Left Outer Join: The Foundation
Let's start with the most commonly used join type: the left outer join.
How Left Joins Work
A left outer join works like this:
It returns all rows from the left table
For each row in the left table, it looks for matching rows in the right table based on a join key
If a match is found, it brings in the values from the right table
If no match is found, it inserts nulls for the right table's columns
Any rows in the right table that don't match the left table are dropped completely
This makes left joins perfect for "enriching" or "widening" your primary dataset with additional information without losing any of your original rows.
Example: Ad Cost vs. Revenue Data
Let's look at a concrete example. Imagine we have two tables, when we apply a left outer join with "Date" as the join key, we get:
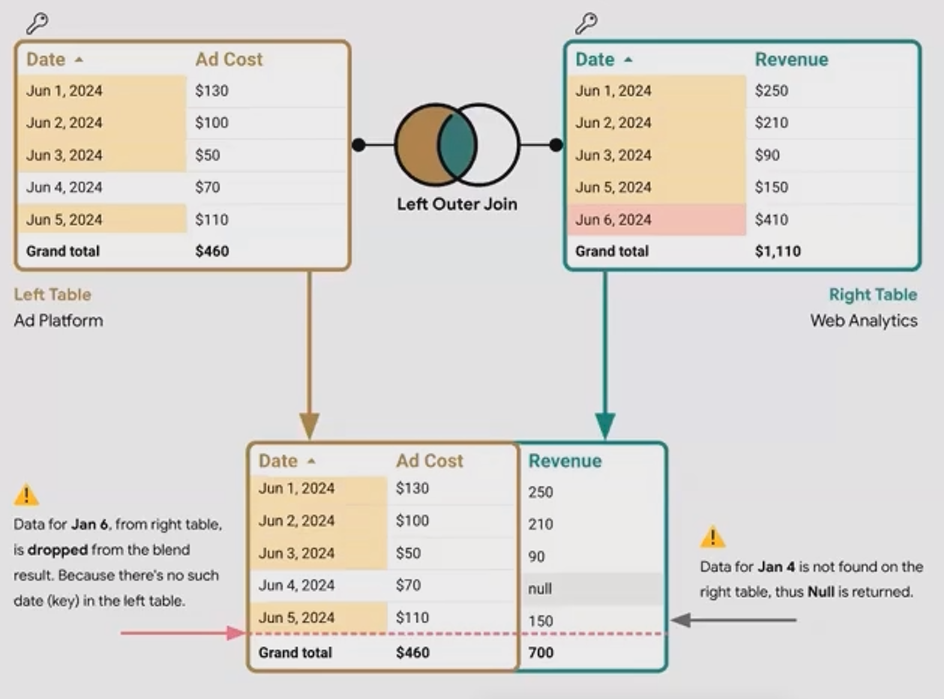
Notice what happened:
All dates from our left table (Ad Cost) are preserved
June 4th has no matching revenue, so it gets a null
June 6th from the Revenue table is completely dropped because it doesn't exist in the left table
In a left join, we're essentially saying, "I care about every row in my left table, and I want to enhance it with matching data from my right table if available."
Inner Join: Finding the Perfect Match
While left joins keep all rows from the left table, inner joins are more selective. They only keep rows that have a match in both tables.
How Inner Joins Work
An inner join works like this:
It only returns rows where the join key exists in both tables
Any row without a match in the other table is dropped, regardless of which table it's from
Think of it as the "intersection" or "overlap" between your two datasets
This makes inner joins ideal when you only want to analyze data points that exist across all of your data sources.
Example: Continuing with Ad Cost and Revenue
Using the same tables from our previous example:
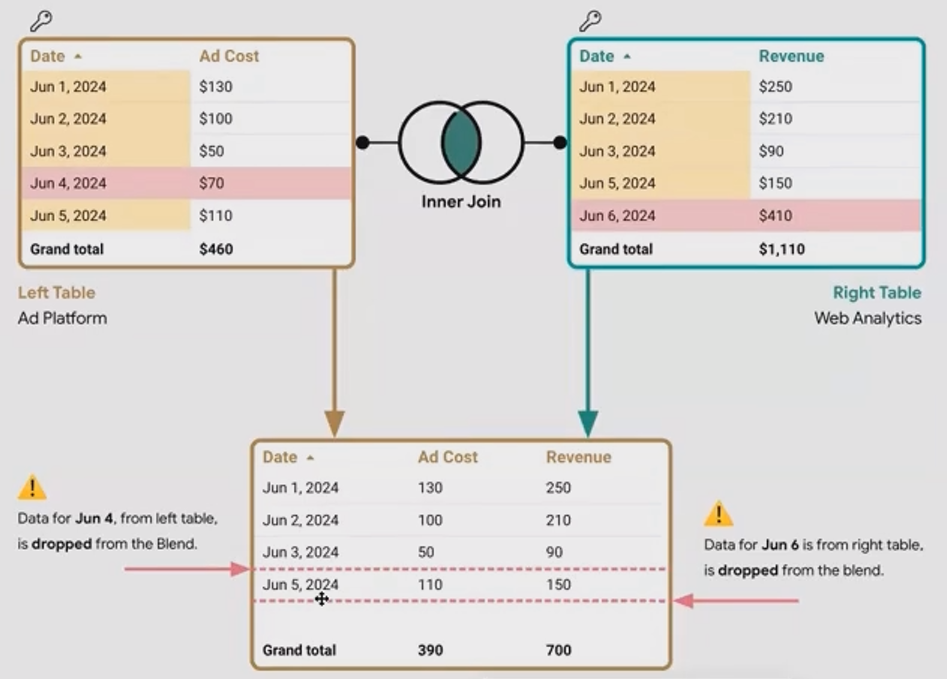
Notice what changed:
June 4th is now completely gone because it doesn't have a matching revenue entry
June 6th is still excluded because it doesn't have a matching ad cost entry
In practical terms, this inner join shows us only the days where we both spent money on ads and recorded revenue.
Real-World Use Case: Cross-Device Analysis
Inner joins shine in scenarios where you're specifically interested in the overlap between datasets. A perfect example is cross-device user analysis.
Imagine you have two tables, if we perform an inner join on User ID, we get:
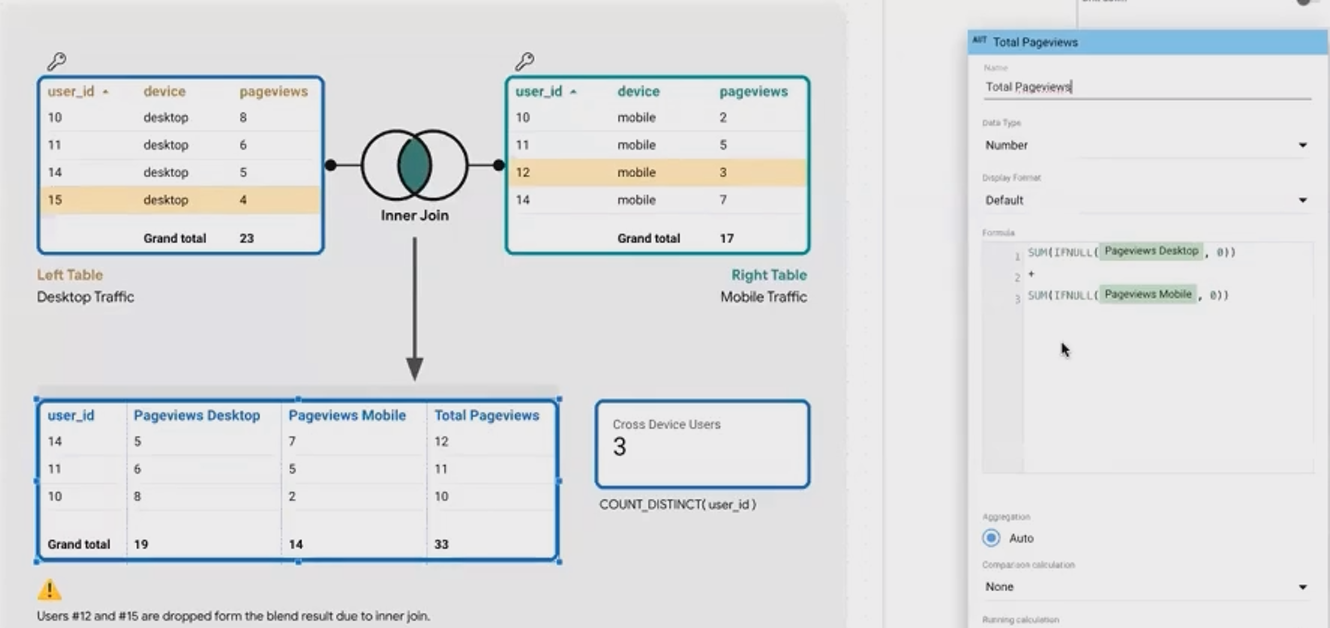
This gives us only the users who visited the site on both desktop and mobile devices. Now we can answer interesting questions like:
How many total page views do cross-device users generate? (33 in this example)
How many unique users visited the site from both desktop and mobile? (3 users)
The inner join allowed us to focus exclusively on users who appear in both datasets, giving us a clean view of cross-device behavior without any null values to handle.
The Critical Role of Table Order in Blends
One of the most overlooked aspects of data blending in Looker Studio is how the order of tables affects the final result.
How Looker Studio Processes Multi-Table Blends
When you blend more than two tables in Looker Studio, the joins happen sequentially, not all at once:
First, Table 1 and Table 2 are joined based on your specified condition
Then, the result of that join is joined with Table 3
That result is joined with Table 4, and so on
This sequence matters tremendously because each join can filter out rows or add nulls, affecting all subsequent joins.
Why This Matters in Practice
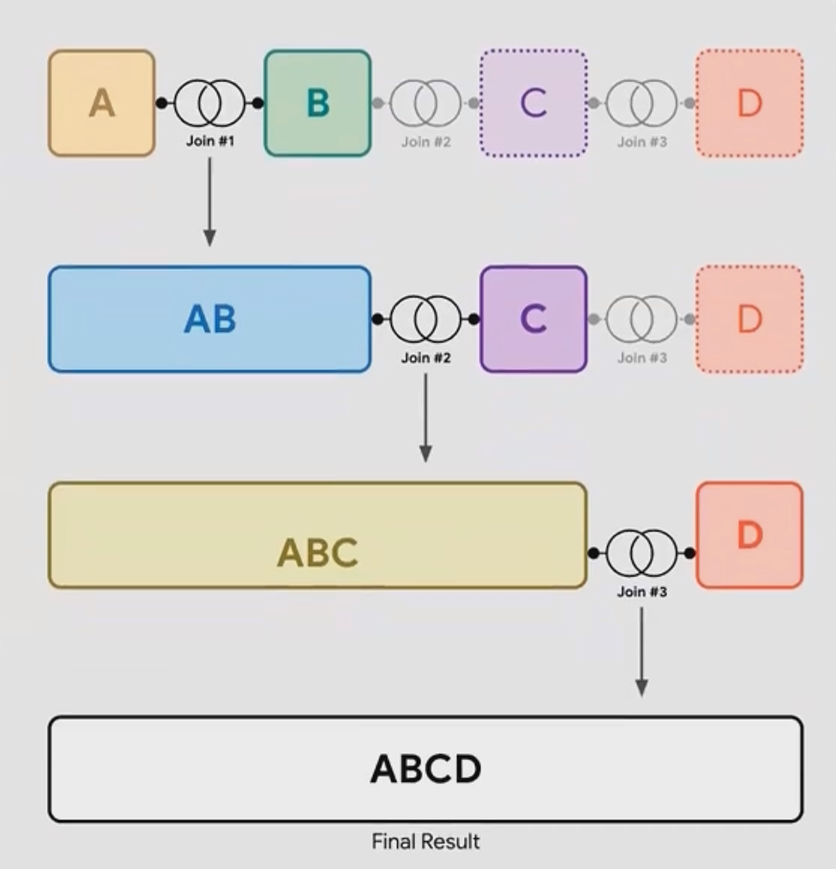
This sequential joining means you need to carefully consider which tables go where, especially when mixing different join types. Here's a simple way to visualize it:
If your blend looks like this: A + B + C + D (where + represents a join)
Looker Studio actually processes it like this: ((A + B) + C) + D
It's similar to how parentheses work in mathematics to control the order of operations. The innermost operation happens first, and the results flow outward.
Best Practice: Build and Verify Step by Step
A common mistake is to add all five tables at once, set up all the join conditions, and hope for the best. This rarely works for complex blends.
Instead:
Start by joining just two tables
Use a table visualization to verify the result looks as expected
Add the third table and check again
Continue adding tables one by one, verifying at each step
This methodical approach will save you hours of troubleshooting and ensure your final blended data source works as intended.
Frequently Asked Questions (FAQs)
When should I use an inner join versus a left join?
Use a left join when you want to preserve all rows from your primary dataset and enrich it with additional data. Use an inner join when you're only interested in analyzing data points that exist across all your data sources. For example, use a left join when adding campaign names to session data (keeping all sessions), but use an inner join for cross-device analysis (focusing only on users who used multiple devices).
How do I troubleshoot "System Error" messages when trying to blend data?
System errors in Looker Studio blends can be frustrating. Try these steps in order:
Refresh the page completely
Refresh the data source (right-click on data source and select "Refresh")
Check if any filters or sorting in your visualization are incompatible with the blended data
Reconnect the data source
Try to repeat the same steps to see if you can identify exactly when the error occurs
What join type would you recommend to combine results from different ad channels?
For combining ad channel data (like Google Ads, Meta, etc.), I typically recommend creating a date table with all dates as your left table, then using left joins to bring in each channel's data. This ensures you don't lose dates where one channel might not have any spend, allowing you to see complete time series data across all channels.
Does the order of tables matter in a two-table blend?
Yes! Even with just two tables, the order matters significantly. The left table determines which rows are preserved in a left join, while the right table's non-matching rows get dropped. Always put your "primary" or "most important" dataset as the left table in a left join.
Remember that mastering join types in Looker Studio is a powerful skill that will elevate your data analysis capabilities. While left joins might handle 95% of your needs, understanding when to use inner joins and how table order affects your results will help you tackle those complex scenarios that truly showcase the value of your analytics expertise.
Note:
This post is based on a subject covered in the Looker Studio Masterclass Program. To learn more about Looker Studio Masterclass, click here.