
Looker Studio Data Blending: Re-Aggregate Metrics & Merge Platforms
In today's data-driven marketing world, the ability to combine information from multiple sources is essential for making informed decisions. Looker Studio's data blending capabilities allow you to merge diverse datasets, revealing insights that would otherwise remain hidden in siloed reports.
Let's explore four powerful data blending techniques that will take your Looker Studio dashboards to the next level.
Merging Platforms: Creating a Unified Cost Analysis
One of the most common data blending use cases is merging cost data from multiple advertising platforms. Imagine you're managing campaigns across Meta (Facebook) and Google Ads, while also tracking monthly ad management fees. Without data blending, you'd need separate reports for each data source.
How to Merge Multiple Platform Data:
Prepare your data sources:
Connect to your Meta Ads data (daily cost metrics)
Connect to your Google Ads data (daily cost metrics)
Connect to your ad management costs (typically monthly fees)
Create your blend:
Select your Meta Ads table first (this becomes your "left" table)
Hold Shift and select Google Ads, then the ad management table
Right-click and select "Blend data"
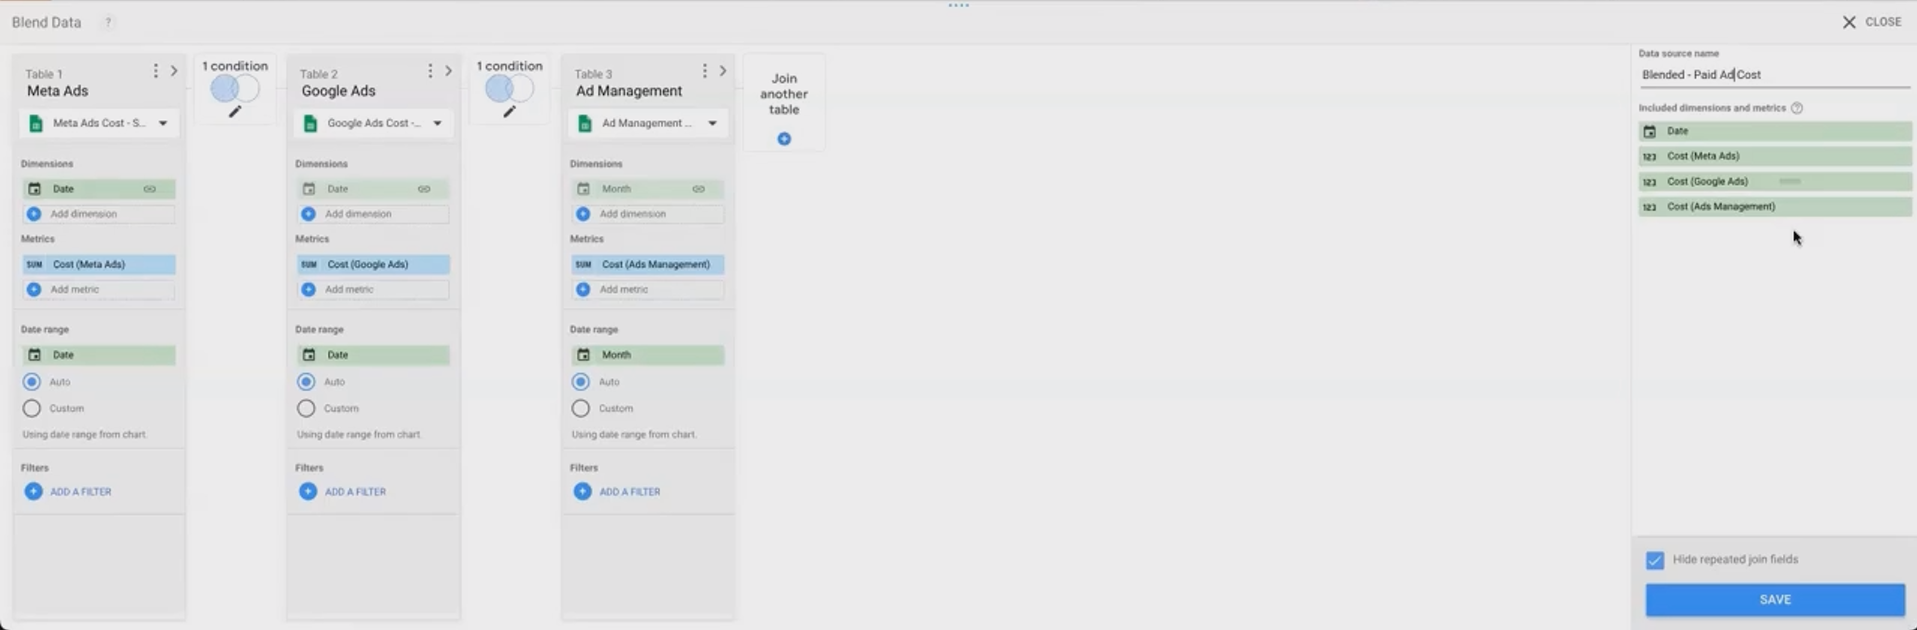
Configure the blend correctly:
Ensure you're using a Left Join with
Dateas your join keyVerify Looker Studio hasn't mistakenly selected other fields as join keys
Rename your metrics for clarity (e.g., "Cost - Meta Ads", "Cost - Google Ads")
Handle null values for complete totals:
Create a calculated field for total cost:
SUM(IFNULL(Cost - Meta Ads, 0)) + SUM(IFNULL(Cost - Google Ads, 0)) + SUM(IFNULL(Cost - Ad Management, 0))Format as currency
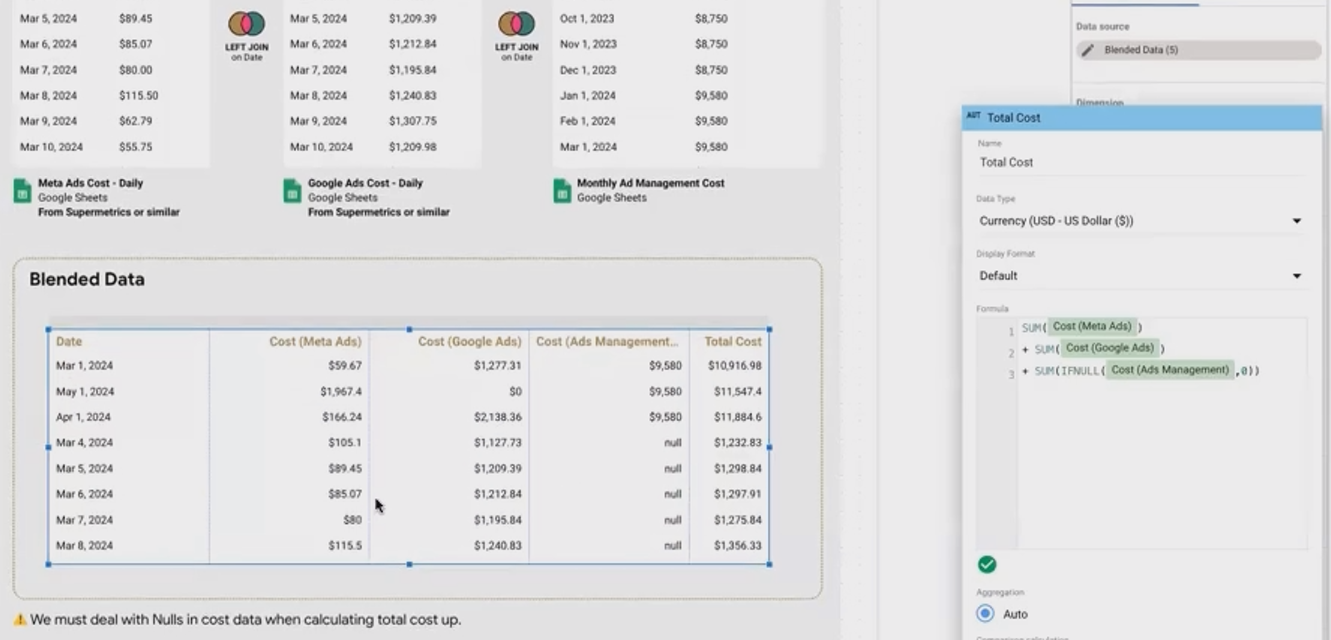
The power of this approach becomes evident when visualizing the data. Rather than just seeing monthly aggregates, you can now analyze daily spending patterns across platforms and identify key trends – like when a client shifted budget from Google Ads to Meta Ads.
Pro Tip: When selecting charts to blend, the order matters! The first chart you select becomes the "left" table in your blend, which determines which data is preserved in a left join.
Rolling Up Accounts: Aggregating Data Across Properties
Another common scenario is needing to combine data from multiple properties within the same platform – like aggregating event data across several Google Analytics 4 properties.
The Step-by-Step Process:
Identify your data sources:
Connect to all relevant GA4 properties you need to aggregate
Ensure they have common metrics and dimensions (like Event Name and Event Count)
Order matters in left joins:
Select the property with the most comprehensive list of events first
Hold Shift and select additional properties
Right-click and select "Blend data"
Configure your blend:
Use a Left Join with "Event Name" as the join key
If needed, reorder tables in the blend editor by using the "Shift Left" button
Rename fields for clarity
Handle missing data:
Create a calculated field for total event count:
SUM(IFNULL(Event Count - Property 1, 0)) + SUM(IFNULL(Event Count - Property 2, 0)) + SUM(IFNULL(Event Count - Property 3, 0))

What makes this technique powerful is the ability to see combined performance across all your properties while maintaining the granularity to analyze individual event types.
Caution: When using Left Join, only events that exist in your leftmost table will appear in the final blend. If a unique event exists only in your second or third property, it won't show up unless you use a different join type.
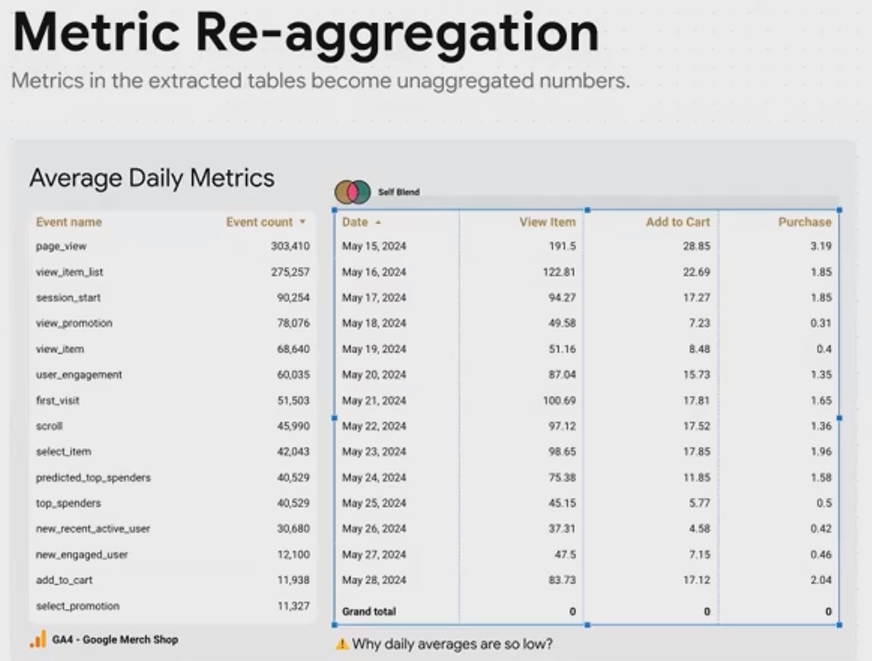
The "Self-Blend" Trick: Re-Aggregating Metrics
One of the most frustrating limitations in Looker Studio is the inability to change how metrics are aggregated. For example, Google Analytics 4 delivers Event Count with "Auto" aggregation (typically SUM), but what if you want to see the average daily event count instead?
This is where the ingenious "self-blend" technique comes in.
How to Re-Aggregate a Metric:
Select a single data source (e.g., your GA4 connection)
Right-click and select "Blend data" (yes, with just one source!)
Add the dimension you want to break down by (e.g., Date)
Add your metric (e.g., Event Count)
Save the blend
By doing this, you force Looker Studio to:
Extract the data broken down by day
De-aggregate the metric into daily values
Allow you to re-aggregate it however you want (AVG, MAX, MIN, etc.)
This works because of how Looker Studio processes blends. Even with just one source, it still performs all three steps of blending:
Extract and de-aggregate
Blend (in this case, with itself)
Re-aggregate based on the chart configuration
This technique also unlocks the ability to create complex calculated fields that mix dimensions and metrics, which is normally prohibited with auto-aggregated metrics.
Important: When calculating averages with potentially missing data, use
IFNULL(metric, NULL)rather thanIFNULL(metric, 0). Using zero would count as a value in your average calculation, artificially lowering the result.
Currency Conversion: Transforming Revenue Across Borders
For businesses operating internationally, reporting revenue in a consistent currency is essential. Data blending makes this straightforward by allowing you to join your revenue data with exchange rate information.
How to Implement Currency Conversion:
Prepare your data sources:
Connect to your revenue data (with Date and USD amounts)
Connect to exchange rate data (with Date and conversion rates)
Ensure dates are in the same format in both sources
Create your blend:
Select your revenue data first
Hold Shift and select your exchange rate data
Right-click and select "Blend data"
Configure your blend:
Use a Left Join with Date as your join key
Include the USD revenue and exchange rate fields in your final blend
Calculate the converted revenue:
Create a calculated field:
SUM(Revenue in USD) * SUM(USD to EUR Rate)Format as currency and select EUR as the currency type
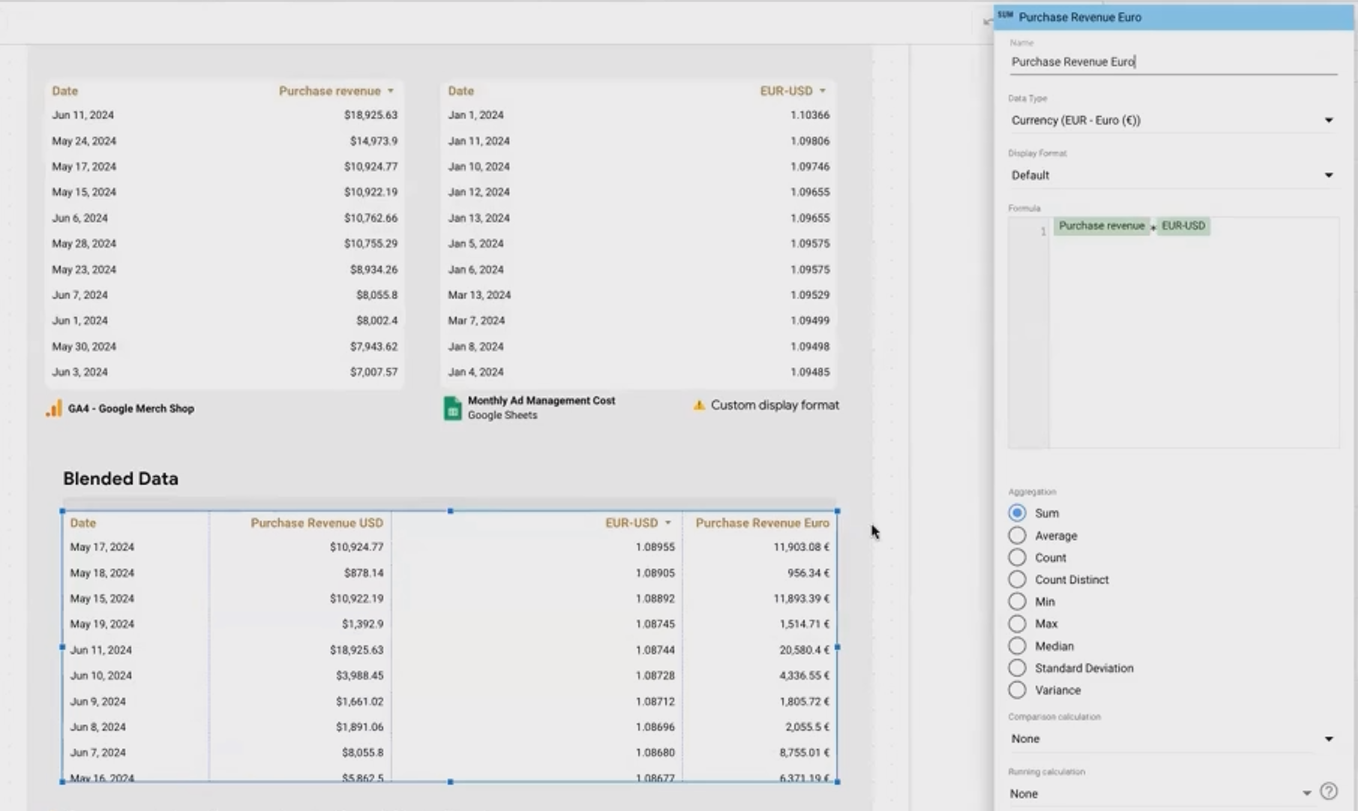
This technique allows you to see your revenue in any currency, updated with the historical exchange rate for each day. The result is much more accurate than simply applying today's exchange rate to all historical data.
Advanced Approach: For more sophisticated currency handling, you can use Google Finance functions in Google Sheets to dynamically pull the latest exchange rates, then blend that sheet with your revenue data in Looker Studio.
Frequently Asked Questions (FAQs)
How do I troubleshoot blending errors when I have thousands of rows?
When dealing with large datasets, finding issues like mismatched values is challenging. Try these approaches:
Use time series charts to spot anomalies or missing data points
Create filters to examine subsets of your data
When possible, perform your joins in BigQuery first, where you can use SQL to validate and troubleshoot
Look for common issues like inconsistent formatting, case sensitivity, or trailing spaces in join keys
When is it better to use a direct connector versus preparing data in Google Sheets first?
Use direct connectors when:
You need real-time data updates
You're working with large datasets
The data doesn't require significant transformation
Use Google Sheets as an intermediary when:
You need to clean or transform data before visualization
You want to combine data from sources without native connectors
You need to apply custom functions (like Google Finance for currency conversion)
Your data volume is modest (under 500,000 cells for reliable performance)
If my left table is missing dates, will I lose data from my right tables for those dates?
Yes, with a left join, any dates that don't exist in your left table will be excluded from the final blend, even if they exist in your right tables. To solve this:
Create a "calendar table" in Google Sheets with all possible dates
Use this calendar as your leftmost table in the blend
Join your actual data tables to this calendar
Handle null values with IFNULL in your calculated fields
Can the metric re-aggregation technique be used to combine any dimension and metric in a calculated field?
Yes, the "self-blend" technique essentially unlocks metrics from their default aggregation, allowing you to:
Combine dimensions and metrics in calculated fields
Apply different aggregations (AVG, MAX, MIN) to originally "Auto" aggregated metrics
Create filtered metrics (e.g., "IF(dimension = 'value', metric, NULL)")
This works because the blend forces Looker Studio to de-aggregate the data during the extraction phase.
Data blending in Looker Studio is more than just combining tables. It's about transforming how you can analyze and visualize your data. By mastering these four techniques (merging platforms, rolling up accounts, re-aggregating metrics, and currency conversion), you'll be able to create more comprehensive, insightful reports that tell the complete story behind your data.
Remember that understanding how Looker Studio processes blends (extract, join, re-aggregate) is key to troubleshooting issues and creating sophisticated data transformations that would otherwise require external tools.
What data sources are you looking to blend in your next report? The possibilities are nearly endless once you master these techniques.
Note:
This post is based on a subject covered in the Looker Studio Masterclass Program. To learn more about Looker Studio Masterclass, click here.