
How to Use Looker Studio's IMAGE() & HYPERLINK() for Dynamic Visuals
In the world of data visualization, static reports can only take you so far. The real magic happens when your dashboards become interactive, responding to the data they're displaying. Today, I'm excited to share two powerful techniques that will transform your Looker Studio reports from passive documents into dynamic, engaging experiences: dynamic images and hyperlinks.
Let's dive into how you can leverage these special data types to create reports that not only inform but truly engage your audience.
Dynamic Images: Bringing Visual Context to Your Data
Static images in reports are nothing new. You've probably added logos, banners, or explanatory graphics to your Looker Studio reports before. But what if those images could change based on your data?
The IMAGE() function in Looker Studio makes this possible, turning text-based information into rich visual content that's instantly understandable.
How the IMAGE() Function Works
The basic syntax is straightforward:
IMAGE(url_field, [alt_text])Where:
url_fieldis a field containing the URL to a publicly accessible imagealt_text(optional) is the text shown when hovering over the image
Creating a Dynamic Image Field
Let's look at a practical example: a real-time order tracking dashboard for a coffee shop.
Imagine you have order data that includes the items ordered (like "latte," "bagel," "espresso"). Instead of just showing these text values, you can display the actual images of these products.
Here's how to set it up:
Step 1: Map your item names to image URLs
Create a calculated field that uses a CASE statement to convert product names to image URLs:
   CASE
     WHEN Item = "bagel" THEN "https://imgur.com/bagel-image-url"
     WHEN Item = "latte" THEN "https://imgur.com/latte-image-url"
     WHEN Item = "espresso" THEN "https://imgur.com/espresso-image-url"
     /* Add more items as needed */
   END
Step 2: Create an image field using the IMAGE() function
Create another calculated field that converts those URLs into actual images:
IMAGE(item_image_url, Item)Here, we're using the original Item name as the alt text, which will appear when users hover over the image.
Step 3: Add the image field to a table
Add this new field to your table, and voilà! Your table now displays product images instead of just text.
A real-time order tracking dashboard showing dynamic product images based on order data
Important Limitations to Keep in Mind
Images can only be displayed in tables: you can't use them in other chart types
The IMAGE() function must be created at the data source level: it won't work if added as a chart-level calculation
The image URLs must be publicly accessible: they can't be behind a login or firewall
Advanced Application: Dynamic Screenshots
One particularly powerful application of the IMAGE() function is generating live screenshots of webpages directly in your reports.
Using a service like URL Box, you can create a calculated field that generates a screenshot URL based on page paths in your Google Analytics data:
CONCAT(
  "https://api.urlbox.io/v1/[YOUR_API_KEY]/png?url=",
  Full_Page_URL,
  "&width=800&height=600"
)
Then apply the IMAGE() function to this field to display actual screenshots of your website pages alongside their analytics data.
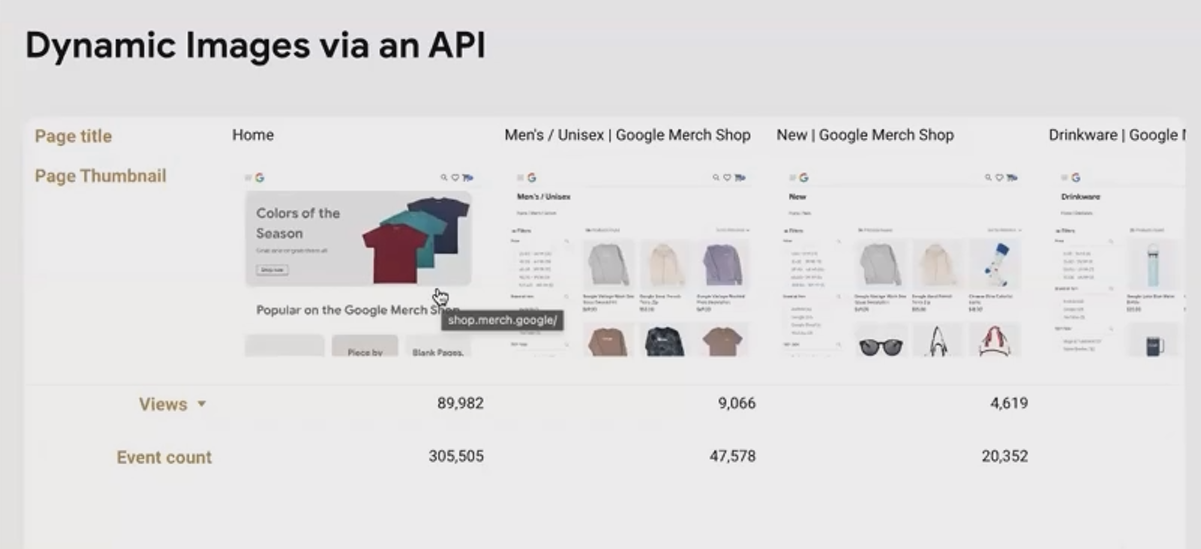
A GA4 report showing live page thumbnails alongside performance metrics
Dynamic Hyperlinks: Making Your Reports Interactive
Static hyperlinks are useful, but dynamic ones take interactivity to another level. The HYPERLINK() function allows you to create clickable links based on your data, making it easy for users to navigate from your report to related resources.
How the HYPERLINK() Function Works
The basic syntax is:
HYPERLINK(url_field, anchor_text)Where:
url_fieldis a field containing the destination URLanchor_textis the text displayed as the clickable link
Creating Simple Dynamic Links
For example, if you're analyzing website traffic in GA4, you might want to include a "View Page" link that takes users directly to the actual webpage.
Create a calculated field:
HYPERLINK(Full_Page_URL, "View Page")When added to your table, this creates a clickable "View Page" link for each row that opens the corresponding URL.
Combining Images and Hyperlinks for Maximum Impact
Here's where things get really interesting: you can combine IMAGE() and HYPERLINK() to create clickable images.
Create a calculated field at the data source level:
HYPERLINK(Full_Page_URL, IMAGE(Page_Thumbnail_URL, Page_Title))This creates an image that, when clicked, opens the corresponding URL. It's perfect for dashboards where you want to provide both visual context and the ability to drill down to the source.
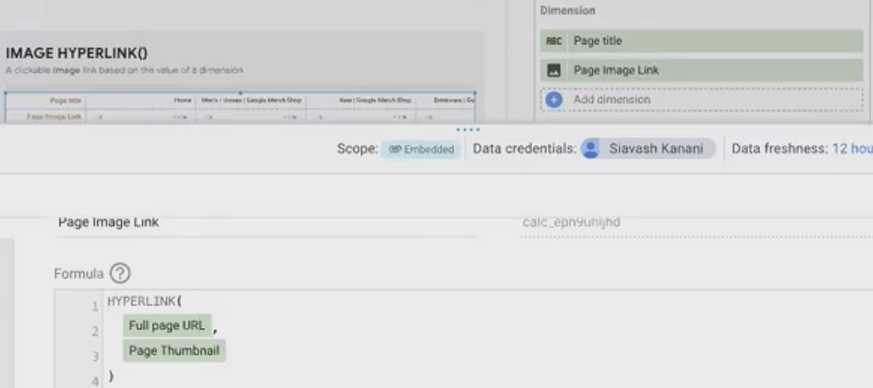
Creating Dimension for Clickable page thumbnails that open the actual webpages when clicked
Practical Applications for Dynamic Elements
These techniques aren't just cool tricks – they solve real business problems:
E-commerce product dashboards: Display product images alongside sales data
Content marketing analytics: Show thumbnails of blog posts with their performance metrics
Social media dashboards: Display post images next to engagement statistics
Inventory management: Show product images alongside stock levels
Customer service dashboards: Display profile pictures of customer service agents alongside their performance metrics
Frequently Asked Questions (FAQs)
Can I use images from Google Drive or other private storage?
The image URLs must be publicly accessible. For Google Drive images, you'll need to make them publicly viewable and use the sharing link format that allows direct access.
Why don't my images appear in my report?
The most common reasons are: 1) The IMAGE() function was created at the chart level instead of the data source level, 2) The image URLs aren't publicly accessible, or 3) The URLs don't directly point to image files with the correct extensions (.jpg, .png, etc.).
Can I resize the images in my tables?
You can't directly control image sizes with the IMAGE() function. However, you can adjust the column width in your table, which will affect how the images are displayed.
Is it possible to create an image that appears when hovering over data instead of as a table cell?
Currently, Looker Studio doesn't support hover-triggered images. Images can only be displayed in table cells using the IMAGE() function.
Do dynamic images impact the performance of my reports?
Yes, especially if you're loading many images or using a screenshot service. Each image requires an additional HTTP request, which can slow down your report. Use them judiciously, particularly in reports with large datasets.
Dynamic images and hyperlinks represent a significant step beyond basic data visualization. They transform static reports into interactive experiences that engage users and provide deeper context for your data.
By mastering these special data types, you'll create reports that not only communicate information more effectively but also enable your audience to take action based on what they see. That's the difference between a report that gets glanced at and one that drives real business decisions.
Ready to take your Looker Studio reports to the next level? Start experimenting with dynamic images and hyperlinks today and watch your dashboards come alive!
Note:
This post is based on a subject covered in the Looker Studio Masterclass Program. To learn more about Looker Studio Masterclass, click here.