
How to use DATETIME_ADD, EXTRACT, and TRUNC in Looker Studio
Working with dates in data analysis is like having a time machine for your business metrics. Whether you're tracking subscription renewals, planning budgets, or analyzing user behavior patterns, mastering date functions will transform how you interpret your data. In this guide, we'll explore some of the most powerful date manipulation techniques in Looker Studio that go beyond simple date filtering.
As a business analyst or marketer, you've likely asked questions like: "How many days are left in this month's budget cycle?" or "When will this customer's subscription renew?" Today, we'll unlock exactly how to answer these questions with practical, code-ready examples.
Adding & Subtracting Dates: Predict Future Events
One of the most practical applications of date functions is predicting future events based on known dates. For subscription businesses, knowing when customers will be charged next is crucial for forecasting cash flow.
How to Calculate Future Dates
Let's say you have a dataset with a "Became Paid Subscriber" date field, and you want to know when each subscriber's first rebill date will be:
DATETIME_ADD(Became Paid Subscriber, INTERVAL 1 MONTH)This simple function adds exactly one month to the subscription date. But what if you want to calculate the next rebill date from today, not just the first one?
DATETIME_ADD(Became Paid Subscriber,
             INTERVAL (1 + DATETIME_DIFF(TODAY(), Became Paid Subscriber, MONTH)) MONTH)
This more complex formula:
Calculates how many months have passed since the subscription started
Adds 1 to get to the next billing cycle
Adds that many months to the original subscription date
Visualizing Future Revenue
Once you've calculated these future dates, you can create a time series chart to visualize upcoming revenue. For a cumulative view that shows how revenue will build throughout the month:
Add your "Next Rebill Date" as the dimension
Use "Monthly Membership Fee" as the metric
Set the chart to "Cumulative"
Change the line style to "Steps" for a more accurate representation

A stepped, cumulative chart shows exactly how your subscription revenue will grow throughout the month
Pro Tip: Cleaning Up Date Displays
When working with date calculations, you'll often get timestamps that include unnecessary time information. To display only the date portion:
Select your date field
Under "Format" choose "Custom Date Format"
Enter a format like "MMMM d, yyyy" (e.g., "June 15, 2024")
Click "Apply"
Breaking Down Dates with Extract & Truncate
Sometimes you need to work with specific components of a date rather than the whole date itself.
Extract: Pulling Components from Dates
The EXTRACT() function lets you pull specific parts from a date:
EXTRACT(YEAR FROM Date Hour Minute)  → Returns 2024
EXTRACT(MONTH FROM Date Hour Minute)    → Returns 5 (for May)
EXTRACT(QUARTER FROM Date Hour Minute)  → Returns 2 (Apr-Jun)
EXTRACT(WEEK FROM Date Hour Minute)    → Returns the week number
EXTRACT(DAY FROM Date Hour Minute)      → Returns the day of month
EXTRACT(HOUR FROM Date Hour Minute)     → Returns the hour (0-23)
For businesses that analyze weekly patterns, EXTRACT(WEEK FROM date) is particularly valuable. However, be careful when using these components for aggregation if your date range spans multiple years: week 22 of 2023 will be grouped with week 22 of 2024 unless you also include the year.
There's also a special extraction type called DAY_OF_YEAR that tells you which day of the year a date represents (1-365):
EXTRACT(DAY_OF_YEAR FROM TODAY()) → If today is May 22, returns 143DATETIME_TRUNC: Rounding Dates Down
While EXTRACT() pulls out components, DATETIME_TRUNC() rounds a date down to a specific unit:
DATETIME_TRUNC(Date Hour Minute, YEAR)    → Returns 2024-01-01
DATETIME_TRUNC(Date Hour Minute, MONTH)   → Returns 2024-05-01
DATETIME_TRUNC(Date Hour Minute, WEEK)    → Returns the start of the week
DATETIME_TRUNC(Date Hour Minute, DAY)     → Returns just the date, no time
DATETIME_TRUNC(Date Hour Minute, HOUR)    → Returns the top of the hour
This is especially useful for grouping timestamps into periods. For example, truncating to MONTH groups all May dates together, regardless of the specific day.
Real-World Application: Budget Pacing
Let's build a practical calculation to see if your ad spend is on track for the month:
First, calculate how many days have passed in the month:
EXTRACT(DAY FROM TODAY())
Then, determine the total days in the current month:
  EXTRACT(DAY FROM
     DATETIME_SUB(
       DATETIME_TRUNC(
         DATETIME_ADD(TODAY(), INTERVAL 1 MONTH),
         MONTH
       ),
       INTERVAL 1 DAY
     )
   )
3. Calculate the target spend to date:
Monthly_Budget * (Days_Passed / Days_In_Month)4. Compare your actual spend to this target to see if you're over or under pacing:
Actual_Spend - Target_Spend
A budget pacing scorecard shows whether you're ahead or behind your planned spending
Counting Dates for Better Analysis
When analyzing performance over time, you often need to know exactly how many days are in your selected period.
Finding the Number of Days in Your Date Range
The COUNT() function can count unique dates in your dataset:
COUNT(Date)This is particularly useful for calculating daily averages:
Total_Revenue / COUNT(Date) --> Average revenue per dayHowever, there's an important limitation: COUNT(Date) only counts dates that have data. If there were no transactions on a particular day, that date won't be counted. This can make your daily averages look artificially high if you have days with no activity.
Days Past in the Month vs. Days Remaining
For budget pacing and forecasting, it's often useful to know how many days are left in the current month:
// Days past in this month
EXTRACT(DAY FROM TODAY())

// Total days in this month
EXTRACT(DAY FROM
  DATETIME_SUB(
    DATETIME_TRUNC(
      DATETIME_ADD(TODAY(), INTERVAL 1 MONTH),
      MONTH
    ),
    INTERVAL 1 DAY
  )
)

// Days remaining in this month
Total_Days_In_Month - Days_Past
Technical Note: The Parameter Bug Workaround
If you're using parameters or calculations that don't directly reference data source fields, you might encounter a "Failed to fetch data from the underlying data set" error. This happens because Looker Studio doesn't query the data source if no fields are referenced.
The solution is to "trick" Looker Studio by including a field from your data source in a way that doesn't affect your result:
Days_Past_In_Month * NARY_MIN(SUM(Sessions), 1)The NARY_MIN function returns the minimum value (1 in this case), but forces Looker Studio to query your data source for the Sessions metric.
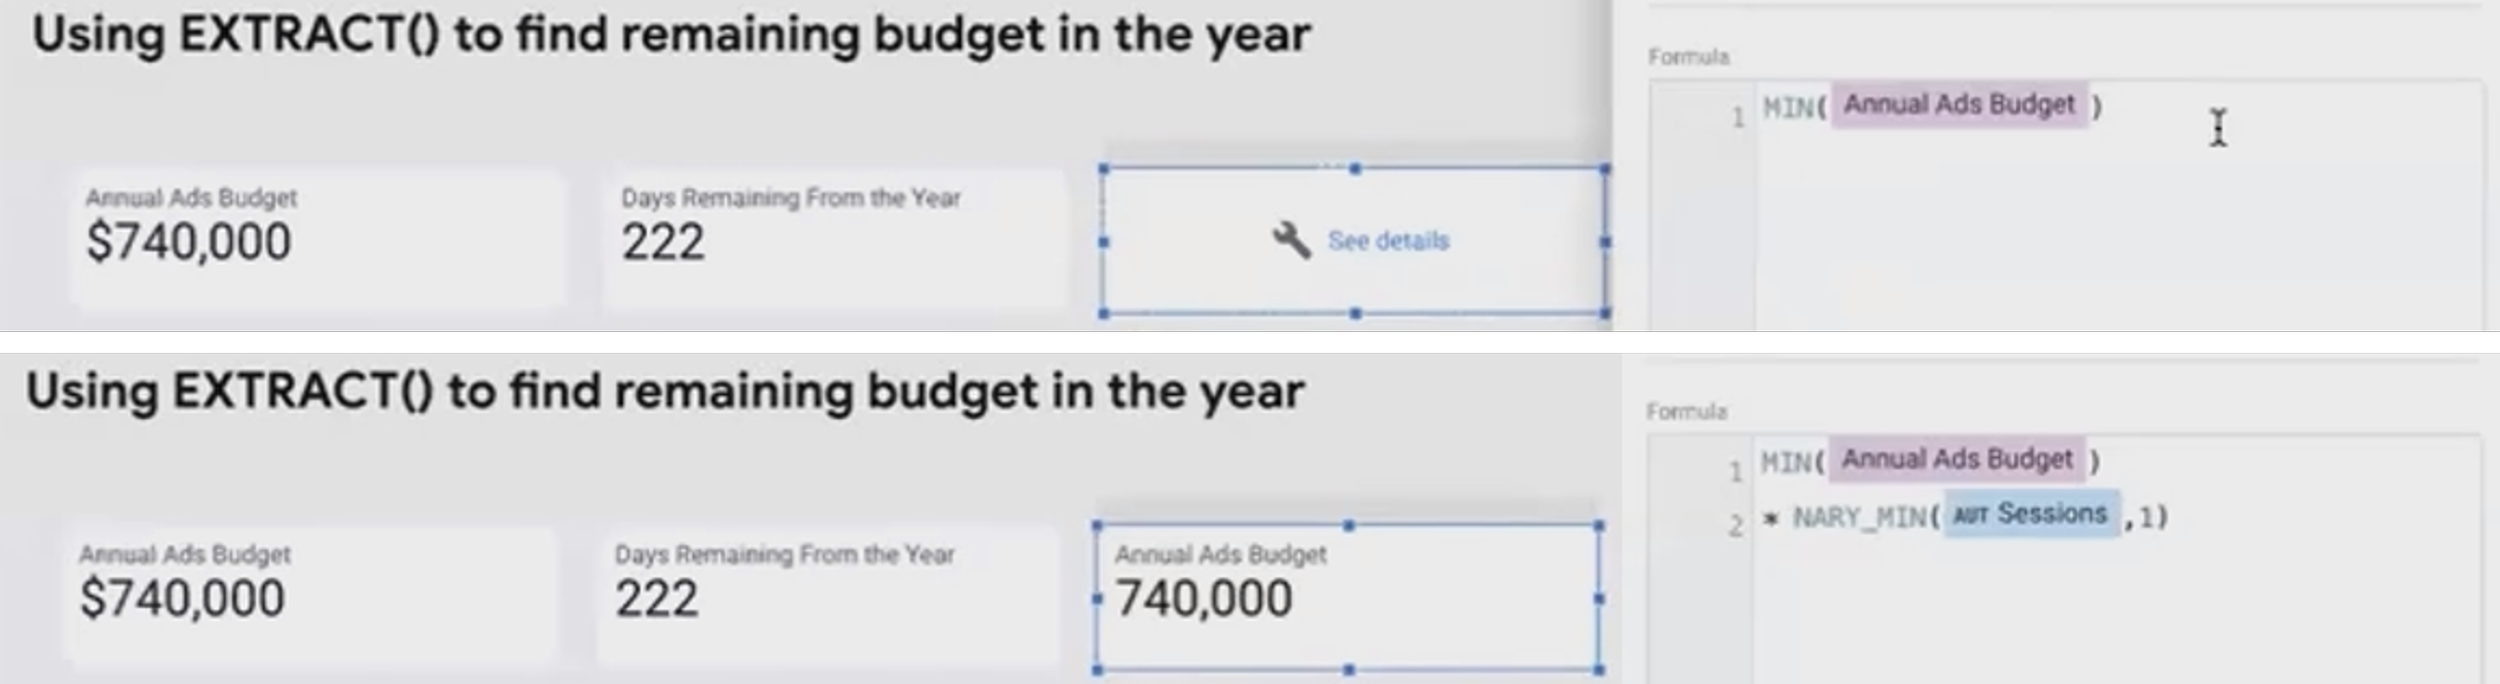
Using NARY_MIN() to trick Looker Studio
Formatting Dates for Clearer Reporting
The final piece of the date puzzle is presenting dates in a readable, meaningful format.
Two Approaches to Date Formatting
FORMAT_DATETIME() - Creates a text representation of a date:
FORMAT_DATETIME("%m/%d/%Y", Date) → Returns "05/22/2024"
The downside: This converts your date to text, meaning you can no longer use it in date calculations or time series charts.
Display Format - Changes how a date appears without changing its data type:
Select your date field
Change the "Display Format" to your preferred format
The date keeps its date properties while displaying in a more readable format
Custom Date Formats
With custom date formats, you can display dates exactly how you want:
"MMM d, yyyy" → "May 22, 2024"
"EEEE, MMMM d" → "Wednesday, May 22"
"EEEE" → "Wednesday" (just the day name)
"QQQ yyyy" → "Q2 2024" (quarter and year)
This is particularly useful for creating clear, scannable reports where the full date format might be overwhelming.
Frequently Asked Questions (FAQs)
Why can't I just subtract the first day of the month from the first day of next month to get the number of days in a month?
While this approach works conceptually, Looker Studio date differences are calculated in whole days, which means you'd need to subtract 1 from the result. The approach we showed (finding the last day of the month) is more direct and less prone to errors.
How can I calculate "Year to Date" metrics that compare to the same period last year?
First, create calculated fields for:
This year's metrics (filter for current year)
Last year's metrics (using
DATETIME_SUB(TODAY(), INTERVAL 1 YEAR)to shift your date range)Calculate the percentage change between them
My date calculations sometimes show "#ERROR" results. What's happening?
This often happens when your formula encounters null values or invalid dates. Always wrap date calculations in IFNULL() or use CASE WHEN statements to handle edge cases where dates might be missing.
Mastering date functions gives you the power to transform raw timestamps into actionable business intelligence. Whether you're forecasting future revenue, analyzing day-of-week patterns, or monitoring budget pacing, these techniques will elevate your Looker Studio reports from basic data tables to strategic decision-making tools.
Note:
This post is based on a subject covered in the Looker Studio Masterclass Program. To learn more about Looker Studio Masterclass, click here.