
Looker Studio Filter Inheritance: How to Control Data Visibility Across Your Reports
Have you ever applied a filter to one chart in Looker Studio only to wonder why it affected (or didn't affect) other charts on your page? The answer lies in understanding filter scopes and inheritance – one of the most powerful yet often misunderstood concepts in Looker Studio.
In today's post, I'm diving deep into how filters cascade through your reports, giving you precise control over what data appears where. This knowledge will transform how you structure your dashboards, saving you hours of frustration and helping you create more intuitive reports for your stakeholders.
The Hierarchy of Scopes: From Report to Chart
Think of your Looker Studio report as a series of nested containers, each with its own scope of influence. At the highest level is your entire report, followed by individual pages, then groups of components, and finally individual charts.
This hierarchy follows a clear pattern:
Report Level - The broadest scope, affecting everything
Page Level - Affects only components on a specific page
Group Level - Affects only components within a defined group
Chart/Component Level - The most specific scope, affecting just one element
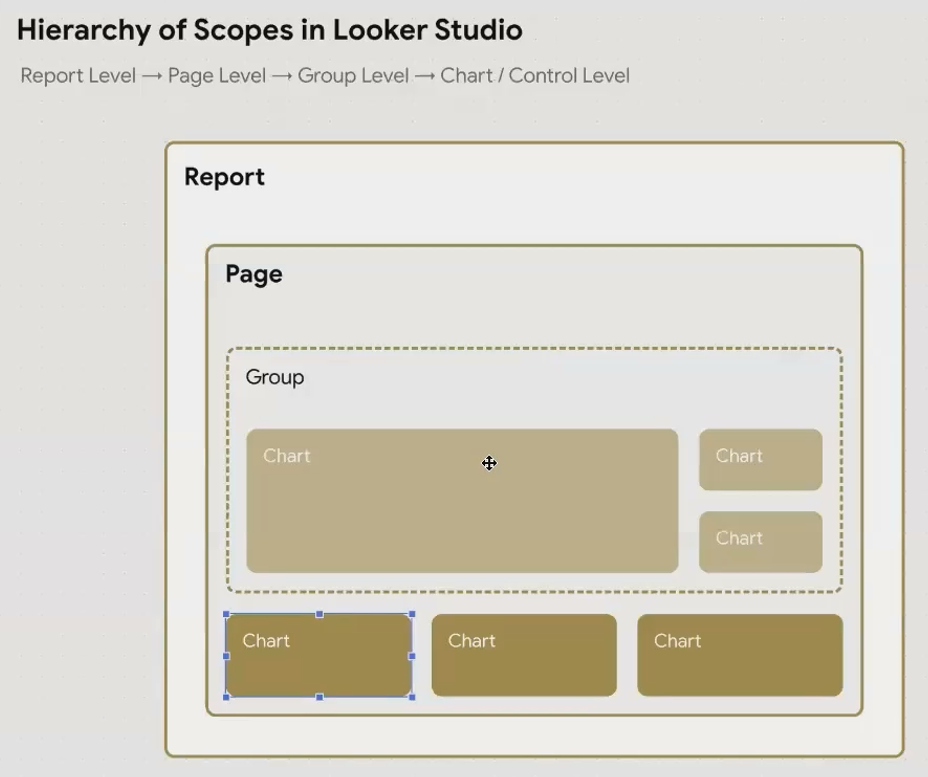
Understanding the scope hierarchy is essential for creating well-structured reports
When you apply a filter at any level, by default, it flows downward through this hierarchy – a concept known as inheritance.
How Filter Inheritance Works in Practice
Let's say you've created a marketing dashboard with multiple pages – one for organic traffic, one for paid campaigns, and another for social media performance.
If you want all pages to exclude data from internal IP addresses, you'd apply that filter at the report level. Every chart on every page will automatically inherit this filter.
On your paid campaigns page, you might add a page-level filter to focus only on Google Ads data. All charts on this page will now show only Google Ads data that doesn't come from internal IPs – they've inherited both filters.
Within that page, you might have a group of charts specifically analyzing mobile performance. You can apply a group-level filter for mobile devices, and only charts within that group will show the triple-filtered data: non-internal traffic + Google Ads + mobile only.
Finally, for one specific chart in that group, you might add a chart-level filter to show only high-value conversions. This chart now has four layers of filtering applied.
Report Filter → Page Filter → Group Filter → Chart Filter
(No internal IPs) → (Google Ads only) → (Mobile only) → (High-value conversions)
The beauty of this system is its flexibility. Each level of filtering narrows the data scope further, creating increasingly focused views of your information.
Breaking the Chain: Disabling Inheritance
Sometimes you need to break this inheritance chain. For example, you might want one chart on your Google Ads page to show a comparison with Facebook Ads data, despite the page-level filter.
For these situations, Looker Studio allows you to disable inheritance at any level. Here's how:
Select the component you want to exempt from inherited filters
Go to the Setup tab in the properties panel
Find the inherited filter you want to disable
Toggle off the "Inherit" option next to that filter
This gives you the freedom to create exceptions where needed while maintaining the overall structure of your reporting hierarchy.

Disabling inheritance for specific filters gives you more flexibility in your report design
The Difference Between Filter and Control Scopes
This is where things get really interesting! While filters (applied by you, the editor) can work at all four scope levels, controls (interactive elements for viewers) operate slightly differently:
Controls can only be applied at either the Page or Group level
A control placed directly on a page (outside any group) affects all compatible charts on that page
A control placed inside a group only affects components within that group
This distinction creates powerful possibilities for report design. For instance, you can create side-by-side analysis sections on a single page:
─────────────────────── PAGE ───────────────────────
│                                                  │
│  ┌─────── GROUP A ─────────┐  ┌─── GROUP B ────┐ │
│  │                         │  │                │ │
│  │  [Country Filter: USA]  │  │ [Country: ALL] │ │
│  │                         │  │                │ │
│  │  USA Sales Chart        │  │ Global Chart   │ │
│  │  USA Conversion Chart   │  │ Global KPIs    │ │
│  │                         │  │                │ │
│  └─────────────────────────┘  └────────────────┘ │
│                                                  │
└──────────────────────────────────────────────────┘
In this layout, when a viewer selects "USA" in Group A's country filter, only the charts in Group A will be filtered. The Group B charts remain unaffected, showing global data.
Real-World Applications of Scope Hierarchy
Understanding scope and inheritance opens up creative solutions for common reporting challenges:
1. Department-Specific Views on a Single Page
Instead of creating separate reports for each department, create groups on a single page with department-specific filters. Each group becomes a mini-dashboard, with its own controls that don't affect other groups.
2. Global vs. Filtered Comparisons
Keep one chart outside any filtering to show global totals, while placing filtered views beside it. This creates an instant comparison between filtered segments and overall performance.
3. Creating Executive Summaries
Apply broad filters at the report level for executives who need clean, focused data, but disable inheritance on specific "deep dive" pages where analysts need to explore the full dataset.
4. Multi-Region Dashboards
Group charts by region with region-specific filters, allowing viewers to modify date ranges or metrics across all regions simultaneously with page-level controls while keeping the regional separation intact.
Frequently Asked Questions (FAQs)
Can I see which filters are currently applied to a specific chart?
Yes! Select the chart and go to the Setup tab in the properties panel. You'll see all filters affecting that chart, including inherited ones with a label indicating their origin (report, page, or group).
Why did my filter stop working when I moved my chart to a different page?
If you applied a filter at the page level, it only works on that specific page. When you move the chart to a new page, it inherits the filters from its new parent page instead. Consider moving the filter to the report level if you need it to follow the chart across pages.
How many filters can I apply at each level?
While there's no strict documented limit, performance may suffer with too many complex filters. As a practical guideline, try to keep it under 10 filters per level, and be mindful of combining filters with complex conditions.
Can I temporarily disable all filters without deleting them?
Unfortunately, Looker Studio doesn't have a "master switch" to disable all filters at once. You'll need to disable them individually, which is why planning your filter hierarchy carefully from the start is so important.
Best Practices for Filter Scope Management
After working with hundreds of reports, I've developed these guidelines for managing filter scopes effectively:
Start broad, then narrow: Apply the most universal filters at the report level, then get more specific as you move down the hierarchy.
Communicate filters visually: Add text annotations or color-coding to make it clear which filters are applied to which sections of your report.
Use groups strategically: Don't just group for visual organization, use groups specifically to control the scope of your filters and controls.
Document your filter structure: For complex reports, maintain a simple diagram of your filter hierarchy to help anyone who might need to edit the report later.
Test with fresh eyes: After setting up a complex filter structure, view your report as if you're seeing it for the first time. Is it clear what data is being shown and what's being filtered out?
Mastering the concepts of scope and inheritance transforms your approach to Looker Studio report design. Rather than creating separate reports for different views of the same data, you can build a single, well-structured report with thoughtfully applied filter scopes.
This not only makes your reports more elegant and easier to maintain but also creates a more intuitive experience for your viewers. They'll be able to interact with controls that affect exactly what they should, nothing more, nothing less.
Whether you're building marketing dashboards, financial reports, or product analytics, understanding filter scope and inheritance will elevate your Looker Studio reports from good to exceptional.
Note:
This post is based on a subject covered in the Looker Studio Masterclass Program. To learn more about Looker Studio Masterclass, click here.