
Mastering Looker Studio Filters: Dimension vs. Metric & Multiple Filter Techniques
Introduction: Adding Power to Your Data Visualization
When building reports in Looker Studio, filters are your secret weapon for focusing your audience's attention on what truly matters. Whether you're trying to highlight top-performing products, exclude irrelevant data, or create multiple views of the same information, understanding how to apply filters properly will transform your reporting capabilities.
In this article, we'll explore two critical aspects of Looker Studio's filtering system:
The difference between dimension and metric filters and when to use each
How to apply multiple filters to the same component for precise data control
Let's dive in and unlock these powerful data-narrowing techniques!
Understanding Dimension vs. Metric Filters
Filters in Looker Studio fall into two distinct categories, each with specific use cases and behaviors. Knowing which type to use can make the difference between a functional report and a broken one.
Dimension Filters: Filtering by Category
Dimension filters operate on categorical fields in your data source. These are typically text-based fields like:
Country or region
Device category
Landing page URL
Campaign name
Product category
The Hidden Power of Dimension Filters
Here's something incredibly useful that many Looker Studio beginners don't realize: you can filter a chart using dimensions that aren't even displayed in the chart itself.
For example, let's say you have a table showing landing pages and session counts, but you want to exclude all traffic from tablets and smart TVs. You can apply a dimension filter based on the device category field, even if that field isn't one of the columns in your table.

This means your table will show landing pages and sessions exclusively from desktop and mobile devices, without needing to add the device category column to your visualization.
Pro Tip: Always communicate hidden filters to your audience. Add a note or subtitle to your chart explicitly stating what data has been excluded, such as "Showing desktop and mobile traffic only."
Metric Filters: Filtering by Value
Metric filters work with numerical fields in your data source, letting you set thresholds and ranges. Common examples include:
Sessions greater than 1,000
Revenue between $500 and $1,000
Conversion rate less than 2%
Bounce rate greater than 60%
Like dimension filters, metric filters can be based on any metric available in your data source, not just those displayed in your chart.
The Summary Row Conflict
A critical limitation to be aware of: metric filters often don't play well with table summary rows when using auto-aggregation (the default setting in Looker Studio).
If you apply a metric filter to a table and the chart breaks or shows an error message like "Metric filters and table summaries are not compatible," the solution is simple:
Select your table
Go to the Style tab
Uncheck the "Summary row" option
This limitation isn't well-documented but is a common stumbling block for Looker Studio users. Understanding it will save you significant troubleshooting time.

Summary row affects on tables while using Metric Filters
Applying Multiple Filters for Precision Control
One filter is good, but multiple filters can provide exactly the data view you need. Looker Studio allows you to apply multiple filters to a single chart, page, or report, giving you incredible control over your data presentation.
How Multiple Filters Work Together
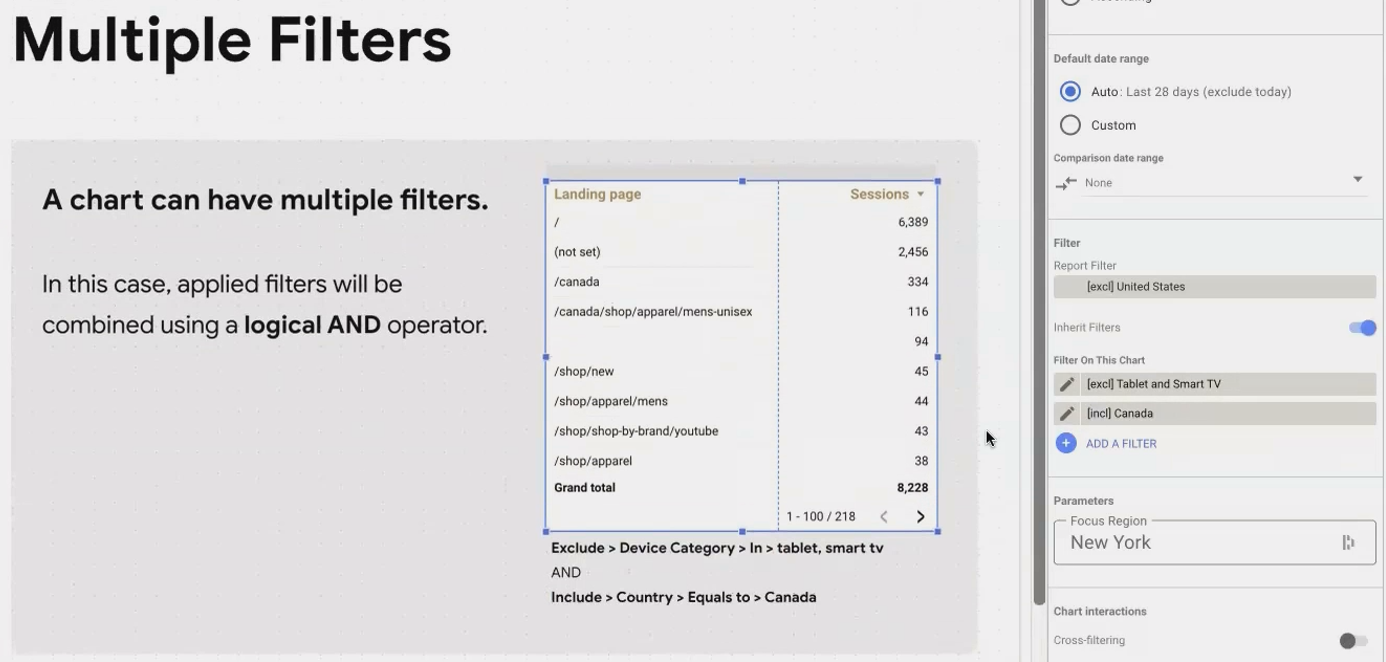
When you apply more than one filter to a component, Looker Studio combines them using a logical AND operator. This means your data must satisfy ALL filter conditions to appear in the visualization.
For example, if you apply these two filters to a chart:
Filter 1: Include where Country = Canada
Filter 2: Exclude where Device Category = Tablet
Your chart will only show data from Canadian users who are NOT using tablets.
This creates a powerful narrowing effect, allowing you to focus on very specific segments of your data. You can stack as many filters as needed (up to Looker Studio's limit), each one further refining your data view.
Avoiding Filter Conflicts
While multiple filters are powerful, they can also create unexpected results if not managed carefully. The most common issue is creating contradictory filter conditions that result in no data being displayed.
Consider this problematic example:
Filter 1: Include where Country = United States
Filter 2: Include where Country = Canada
Since these filters are combined with AND logic, Looker Studio is essentially looking for rows where the country is BOTH United States AND Canada simultaneously, which is impossible. Your chart will show no data.
To avoid this, ensure your filters are logically compatible. If you want to include multiple values of the same dimension, use a single filter with the "in" operator:
Filter: Include where Country in (United States, Canada)Pro Tip: When troubleshooting a chart that suddenly shows no data, check for conflicting filters first. Look at the filter list in the Setup tab and verify that it's logically possible for data to satisfy all conditions simultaneously.
Strategic Applications for Multiple Filters
Let's explore some practical examples of how dimension and metric filters can be combined to create focused data views:
Focusing on High-Value Traffic
Combine these filters to analyze only your most valuable traffic sources:
Filter 1: Include where Sessions > 1000
Filter 2: Include where Conversion Rate > 2%
This combination helps you identify which high-traffic sources are also delivering conversions.
Regional Performance Analysis
For an analysis of mobile performance in specific markets:
Filter 1: Include where Country in (France, Germany, Italy)
Filter 2: Include where Device Category = Mobile
Filter 3: Exclude where Bounce Rate > 70%
This creates a focused view of engaged mobile users in your European markets.
Campaign ROI Assessment
To evaluate campaign effectiveness:
Filter 1: Include where Campaign Source contains "q4_promotion"
Filter 2: Include where Revenue > 0
Filter 3: Exclude where Cost > Revenue
This isolates only profitable interactions from your Q4 promotional campaigns.
Frequently Asked Questions (FAQs)
Can I apply a filter based on one dimension to affect data from another dimension?
Absolutely! This is one of the most powerful aspects of dimension filters in Looker Studio. For example, you can filter a chart showing page performance based on the device category, even if device category isn't shown in the chart.
Is there a limit to how many filters I can apply to a single chart?
While Looker Studio doesn't explicitly state a hard limit, practical experience suggests you can apply up to 10 filters to a single component before potentially encountering performance issues.
How can I include multiple values in a single filter without creating separate filters?
Use the "in" operator when creating your filter. This allows you to provide a comma-separated list of values to include or exclude (e.g., Country in (US, Canada, Mexico)).
Why does my chart break when I add a metric filter?
The most common cause is a conflict between metric filters and summary rows in tables. Try disabling the summary row in the Style tab of your chart properties. If that doesn't resolve the issue, check that your metric filter condition isn't eliminating all data (e.g., a filter for Sessions > 1,000,000 might eliminate all rows if your highest session count is lower).
Can I apply a filter that uses OR logic instead of AND between conditions?
Looker Studio doesn't directly support OR logic between separate filters. However, you can often achieve OR logic by using the "in" operator within a single filter (e.g., Country in (US, Canada) is effectively "Country = US OR Country = Canada").
Mastering dimension and metric filters and knowing how to combine them effectively, gives you precise control over what data appears in your Looker Studio reports. Whether you're excluding irrelevant information, highlighting top performers, or drilling down into specific segments, these filtering techniques help you present exactly the data your audience needs to see.
Remember these key points:
Dimension filters work with categorical data; metric filters work with numerical values
You can filter based on any field in your data source, even if it's not displayed in your chart
Multiple filters combine with AND logic, progressively narrowing your data view
Watch out for summary row conflicts with metric filters
Always communicate applied filters to your audience for transparency
By applying these filtering techniques strategically, you'll create more focused, relevant reports that help your audience quickly find the insights they need.
Note:
This post is based on a subject covered in the Looker Studio Masterclass Program. To learn more about Looker Studio Masterclass, click here.