
Looker Studio Bridge Fields: The Ultimate Guide to Cross-Data Source Filtering
One of the most frustrating limitations in Looker Studio is the inability to filter charts connected to different data sources with a single control. Imagine creating a comprehensive marketing dashboard pulling data from Google Analytics, Google Ads, and a custom CRM spreadsheet. By default, you'd need separate filters for each data source, forcing your viewers to make the same selection three times just to filter their view consistently.
But what if I told you there's a workaround? A little-known technique called "Bridge Fields" can solve this problem elegantly, giving you the power to create truly unified reports across disparate data sources.
In this guide, we'll explore:
Why filters normally can't work across different data sources
The technical solution using Bridge Fields
A step-by-step walkthrough to implement this technique
Real-world applications to enhance your reporting workflow
Let's break down the barriers between your data sources and create a seamless experience for your report viewers!
The Data Source Dilemma: Why Cross-Filtering Fails
Before we dive into the solution, it's essential to understand why this limitation exists in the first place.
Filters Live in Data Sources
The fundamental principle to grasp is that filters in Looker Studio are intrinsically tied to a specific data source. When you create a filter, you're defining a condition based on fields that exist within a particular data source.
This creates a parent-child relationship:
Parent: The data source (e.g., Google Analytics 4)
Child: The filter that lives within it (e.g., "Country = United States")
Since each filter belongs to exactly one data source, it can only filter charts connected to that same data source. Even if you have identical field names across different data sources (like "Country" in both Google Analytics and a Google Sheet), Looker Studio treats them as entirely separate entities.

The Technical Explanation: Field IDs
Behind the scenes, Looker Studio doesn't actually identify fields by their display names but by unique Field IDs. These IDs are invisible to users but crucial to how the platform works.
For example:
"Country" in Google Analytics might have a Field ID of
ga_country_20220601"Country" in your Google Sheet might have a Field ID of
sheet_dim_country_xyz
When you create a filter or control, it references a specific Field ID, not just the field name. This is why a control for "Country" from Google Analytics can't affect a chart showing "Country" from a Google Sheet and they have different underlying Field IDs despite sharing the same name.
The Bridge Field Solution
The key insight is this: if Field IDs are the problem, what if we could create fields with identical IDs across different data sources? That's exactly what Bridge Fields accomplish.
What Is a Bridge Field?
A Bridge Field is a custom calculated field that you create in multiple data sources, manually assigning the same Field ID to each instance. This shared ID creates a "bridge" between your data sources, allowing a single control to filter charts from any data source containing this bridge field.
The concept isn't officially documented by Google, but it's a powerful technique used by Looker Studio experts to overcome the platform's native limitations.
When to Use Bridge Fields
Bridge Fields are perfect for scenarios like:
Multi-platform marketing reports: When you need to filter data from Google Ads, Facebook Ads, and other platforms by the same campaign names
Cross-department dashboards: When combining data from different departments that share common dimensions like product categories or customer segments
Before/after analysis: When comparing data from different time periods stored in separate data sources
Basically, anytime you have multiple data sources that share conceptually identical dimensions (like countries, products, campaigns), Bridge Fields can help you unify the filtering experience.
Creating Bridge Fields: Step-by-Step Guide
Let's walk through the process of setting up Bridge Fields across multiple data sources:
Step 1: Identify Common Dimensions
First, identify the dimensions that exist across your data sources that would benefit from unified filtering. Common examples include:
Country/Region
Campaign Name
Product Category
Date dimensions
Step 2: Create Your First Bridge Field
Go to Resource > Manage added data sources
Select your first data source and click Edit
Click Add a Field
Name your field descriptively (e.g.,
b_Countrywhere "b" indicates it's a bridge field)For the formula, simply reference the original dimension (e.g.,
Country)This is the critical step: Click on the automatically generated Field ID and replace it with a custom, simple ID (e.g.,
country_bridge)Use lowercase letters and underscores
Avoid spaces and special characters
Choose something memorable and descriptive
Click Save

The crucial moment: replacing the auto-generated Field ID with your custom bridge ID. You can only do this during initial field creation!
Step 3: Repeat for All Data Sources
For each additional data source:
Follow the same steps to create a new calculated field
Use a consistent naming convention (e.g.,
b_Country_GA,b_Country_Sheets)Use the exact same Field ID you used in the first data source
Ensure the field returns the correct dimension values from each data source
Pro Tip: Copy your custom Field ID to a notepad after creating the first bridge field. You'll need to paste the exact same string when creating the bridge fields in other data sources.
Step 4: Create a Control Using the Bridge Field
Add a filter control to your report (e.g., a drop-down list)
For the data source, you can choose any of the data sources containing your bridge field
For the Control Field, select your bridge field (e.g.,
b_Country)Configure other settings as needed
Save and test
Step 5: Test and Verify
Create charts using each of your data sources
Use your bridge field control to filter
Verify that all charts update correctly when you make a selection
If any charts aren't updating, double-check that you've:
Created the bridge field in that chart's data source
Used the exact same Field ID
Selected the bridge field (not the original dimension) for your control
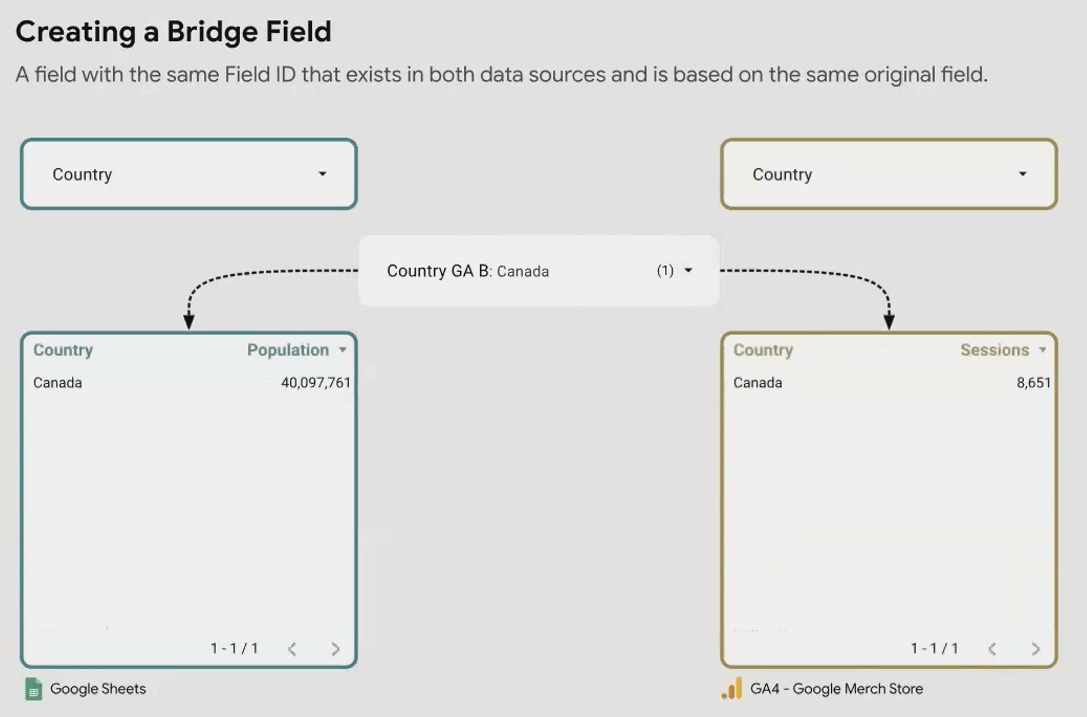
Example: Bridging Google Analytics and Google Sheets
Let's see this in action with a practical example:
Imagine you have a report with:
Google Analytics 4 data showing website traffic by country
Google Sheets data showing sales targets by country
By default, you'd need two separate country filters. But with bridge fields:
In Google Analytics, create a field called
b_Country_GAwith the formulaCountryand Field IDcountry_bridgeIn Google Sheets, create a field called
b_Country_Sheetwith the formulaCountryand the identical Field IDcountry_bridgeAdd a drop-down control using either data source, selecting the bridge field
Now when you select "United States" in this single control, both your GA traffic chart and your Sheets sales target chart will filter to show only US data
Beyond Controls: Bridge Fields for Report-Level Filters
Bridge Fields aren't just for viewer-facing controls, they also work with editor-defined filters at any scope level:
Chart filters: Apply a filter using a bridge field to filter an individual chart
Group filters: Filter multiple grouped components
Page filters: Filter an entire page
Report filters: Filter your entire report
This means you can create report-level filters that affect charts from multiple data sources; something normally impossible in Looker Studio.
For example, you could create a report specifically for the US market by applying a bridge field-based filter at the report level: b_Country IN (United States). This filter would apply to all charts regardless of their data source, as long as they have the bridge field defined.
Advanced Applications of Bridge Fields
Once you master the basic concept, you can get creative with Bridge Fields:
Custom Dimension Mapping
Sometimes dimensions across sources don't match exactly. For example, "USA" in one source versus "United States" in another. Bridge Fields can normalize these differences:
Copy codeCASE
WHEN Country = "USA" THEN "United States"
WHEN Country = "UK" THEN "United Kingdom"
ELSE Country
ENDBy applying this logic in your bridge field formula, you ensure consistent values across data sources.
Multi-Dimension Bridges
You can create bridge fields that combine multiple dimensions:
CONCAT(Campaign," - ",Channel)This would create consistent campaign-channel combinations across different data sources.
Hierarchical Filtering
Create multiple related bridge fields to enable drill-down filtering:
b_Regionfor continent-level filteringb_Countryfor country-level filteringb_Cityfor city-level filtering
With the right formulas, selecting North America in a region control could then limit the country control to show only North American countries.
Frequently Asked Questions (FAQs)
Can I edit the Field ID of an existing field?
No, unfortunately. You can only set the custom Field ID when first creating the field. If you need to make changes, you'll need to delete the field and recreate it with the correct ID.
How many bridge fields can I create?
There's no specific limit to bridge fields beyond Looker Studio's general limit of calculated fields. You can create bridge fields for as many dimensions as needed.
Do bridge fields work with date ranges?
Yes! Date dimensions are some of the most useful to bridge across data sources. The process is the same—create date-based bridge fields with identical IDs.
Will bridge fields affect performance?
Bridge fields add minimal performance overhead since they're simple pass-through calculations. The bigger factor is how many data sources you're connecting to overall.
Can I use bridge fields with blended data?
Yes, but with caution. You might need to create the bridge field in both the original data sources and in the blended data source, depending on your reporting structure.
Bridge Fields represent one of those "power user" techniques that can dramatically elevate your Looker Studio reports. By breaking down the barriers between data sources, you create a more intuitive experience for your viewers and save yourself countless hours of redundant filter configuration.
While it requires a bit more upfront work, the payoff is substantial: truly unified reports that treat your data as a cohesive whole rather than isolated silos. Your viewers will appreciate the streamlined interface, and you'll benefit from the flexibility to build more sophisticated, integrated dashboards.
Remember that the key to successful bridge fields is consistency, use clear naming conventions, document which fields you've bridged, and ensure you're using the exact same Field ID across all data sources.
Now go forth and bridge those data gaps!
Note:
This post is based on a subject covered in the Looker Studio Masterclass Program. To learn more about Looker Studio Masterclass, click here.