
Looker Studio Filter Controls Guide: How to Create Intuitive, Interactive Reports
If you've been using Looker Studio for a while, you've likely created some basic reports with tables, charts, and maybe a date range selector. But to truly unlock the platform's potential, you need to master its filtering capabilities.
In this guide, we'll explore the advanced world of filters and controls in Looker Studio tools that transform static reports into dynamic, interactive dashboards that answer your viewers' specific questions.
We'll start with the fundamental difference between filters and controls, explore how they're tied to data sources, and provide practical examples that you can apply to your own reports immediately. Whether you're creating dashboards for executives, marketers, or analysts, understanding these concepts will elevate your Looker Studio skills to the next level.
Let's dive in!
The Fundamental Difference: Filters vs. Controls
At first glance, filters and controls might seem like the same thing. They both restrict the data shown in your reports. However, they serve entirely different purposes and audiences.
What Are Filters?
Filters are the editor's tool. As a report creator, you apply filters to permanently restrict what data appears in a specific chart or component.
Key characteristics of filters:
Applied by: Report editors during creation
Visibility: Invisible to end-users unless explicitly communicated
Purpose: To pre-filter data before it reaches the viewer
Location: Found in the Setup tab of a component's properties panel

Here's a practical example: Imagine you're creating a sales dashboard, but you want to exclude a terminated employee (John Williams) from the performance metrics. You'd select your sales table, navigate to the Setup tab, scroll down to "Add a filter," and create a rule that excludes data where "Sales Manager = John Williams."
Pro Tip: Always add a text note or adjust your chart title to communicate any background filters you've applied. This prevents confusion when viewers compare your report to other data sources.
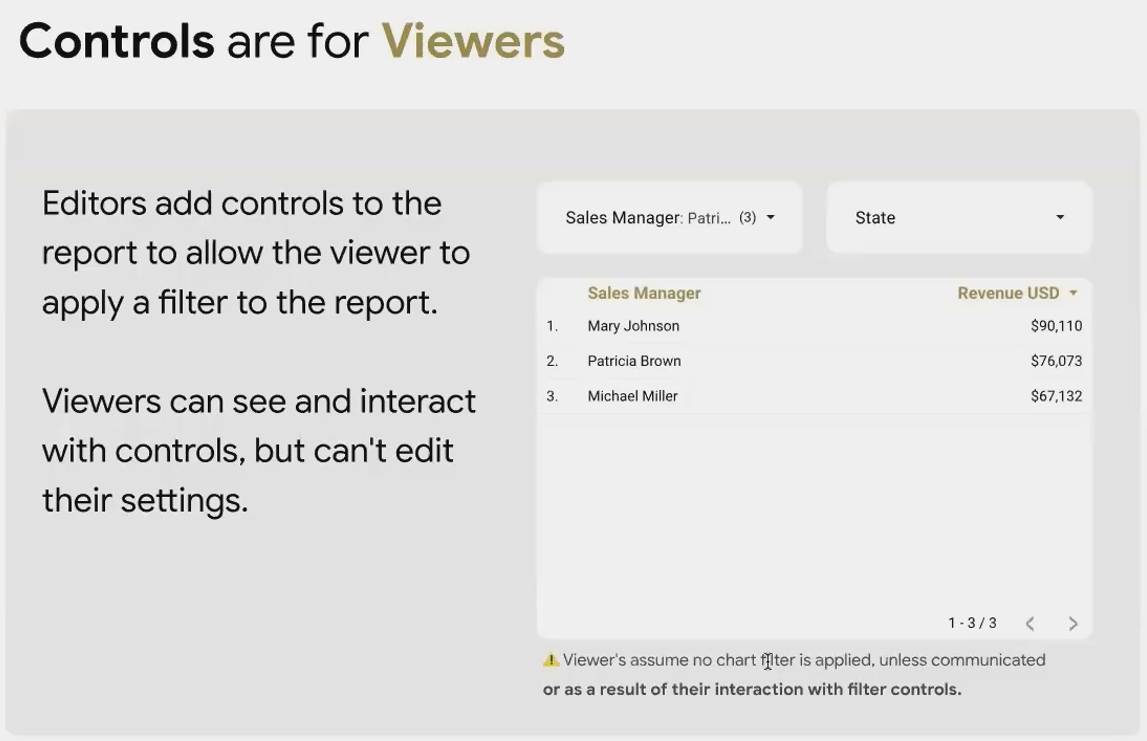
What Are Controls?
Controls are the viewer's tool. You add controls to empower your audience to filter the data themselves based on their specific questions.
Key characteristics of controls:
Applied by: Viewers during report consumption
Visibility: Highly visible on the report canvas
Purpose: To allow viewers to explore data from different angles
Location: Added directly to the report canvas from the "Add a control" menu
For example, you might add a "Sales Manager" drop-down control to let viewers select which managers' performance they want to analyze. They can select one, multiple, or all managers to customize their view.
The Relationship Between Filters and Controls
Here's where it gets interesting and potentially confusing. A single chart can be affected by:
A background filter applied by you (the editor)
A control being used by your viewer
Both at the same time
When both are in play, Looker Studio applies them in sequence:
First, your background filter restricts the data
Then, the viewer's control further filters that already-restricted dataset
This can lead to some unexpected behavior. For instance, if you've filtered out John Williams at the chart level, but your drop-down control still shows his name (because you haven't filtered the control), viewers might be confused when selecting him yields no results.
Where Filters Live: Understanding Data Source Connection
One of the most important concepts to grasp is that filters are intrinsically tied to specific data sources. This relationship impacts how and where you can apply filters in your reports.

The Parent-Child Relationship
Think of it this way: A filter is a child of a data source. It cannot exist independently, it must be created within the context of a specific data source, and it can only filter data from that source.
This relationship exists because filters operate on fields (dimensions and metrics), and fields only exist within data sources.
Creating Filters from Different Starting Points
There are two ways to create a filter in Looker Studio, and each has different implications for data source selection:
Method 1: Starting from a Chart
When you select a chart and add a filter from its properties panel:
Looker Studio automatically uses the data source connected to that chart
You cannot change which data source the filter belongs to
You can only use fields from that specific data source in your filter condition
Method 2: Starting from the Filter Manager
When you create a filter from Resource > Manage filters:
You must first select which data source the filter will belong to
Once selected, you can only use fields from that data source
This method gives you more control over where the filter "lives"
Important: Remember that a filter created for one data source cannot directly filter charts connected to different data sources. We'll explore workarounds for this limitation in the "Bridge Fields" section of an upcoming post.
Practical Implications
This parent-child relationship has several practical implications for your report design:
Report Organization: If your report uses multiple data sources, you'll need to carefully plan your filtering strategy
Filter Reusability: A filter created for your Google Analytics data source cannot be reused for your Google Sheets charts
Control Configuration: When setting up controls, you must connect them to the appropriate data source for them to work with your charts
Frequently Asked Questions (FAQs)
Can I apply a filter to a chart without displaying the field I'm filtering on?
Absolutely! This is one of the most powerful features of dimension filters. For example, you can filter a table of landing pages and sessions to only show data from mobile devices, even if the device category isn't displayed in the table. Just remember to clearly communicate this "invisible" filter to your viewers.
Why does my chart break when I add a metric filter?
The most common reason is that you have a summary row enabled on your table. Metric filters and summary rows are often incompatible in Looker Studio. To fix this, go to the Style tab of your chart and uncheck the "Summary Row" option.
Can I use the same filter for multiple charts to ensure consistency?
Yes, but those charts must use the same data source. The most efficient approach is to apply the filter at a higher level in the scope hierarchy, either at the page level, group level, or report level. This ensures all charts within that scope are filtered consistently.
How do I know if a chart has a filter applied to it?
Look in the Setup tab of the chart's properties panel. Any applied filters will be listed in the "Filters" section. Inherited filters (from page, group, or report level) will be labeled with their source.
Can viewers see what filters I've applied to a chart?
No, chart-level filters are invisible to viewers unless you explicitly communicate them through text annotations or in the chart title. This is why clear communication is essential for transparent reporting.
Understanding the difference between filters and controls, as well as how they relate to data sources, is fundamental to creating effective Looker Studio reports. Filters empower you as an editor to curate the data story, while controls empower your viewers to explore that story from different angles.
In our next installment, we'll explore dimension and metric filters in greater detail, including their specific behaviors and limitations. We'll also dive into the powerful concept of filter scope and inheritance, which allows for sophisticated filtering hierarchies in your reports.
Ready to put these concepts into practice? Start by auditing your existing reports, identify where you're using filters vs. controls, and consider whether your approach aligns with your viewers' needs and goals.
Note:
This post is based on a subject covered in the Looker Studio Masterclass Program. To learn more about Looker Studio Masterclass, click here.