
How to Use DATE_DIFF, TODAY & WEEKDAY in Looker Studio
Data without context is just numbers. And one of the most powerful contexts we can add? Time.
Whether you're analyzing user behavior, tracking campaign performance, or forecasting future trends, understanding how to manipulate dates in Looker Studio will elevate your reporting from basic metrics to actionable insights.
In this guide, we'll explore three foundational date functions that will transform how you work with time-based data: DATE_DIFF(), TODAY(), and WEEKDAY(). Let's dive in!
Calculating Time Periods with DATE_DIFF()
Imagine you run a SaaS business and want to know: How long does it take for users to convert from free trials to paid subscriptions? This is where DATE_DIFF() becomes your best friend.
How DATE_DIFF() Works
The DATE_DIFF() function calculates the difference between two dates in days. Its syntax is straightforward:
DATE_DIFF(more_recent_date, earlier_date)Important: The more recent date must come first in the formula, followed by the earlier date.
Practical Example: From Trial to Paid
Let's say we have a dataset with two date fields:
Started Free Trial: when a user began their trialBecame Paid Subscriber: when they converted to a paid plan
We can calculate the days between these events with:
DATE_DIFF(Became Paid Subscriber, Started Free Trial)This gives us the number of days in the trial period for each user:
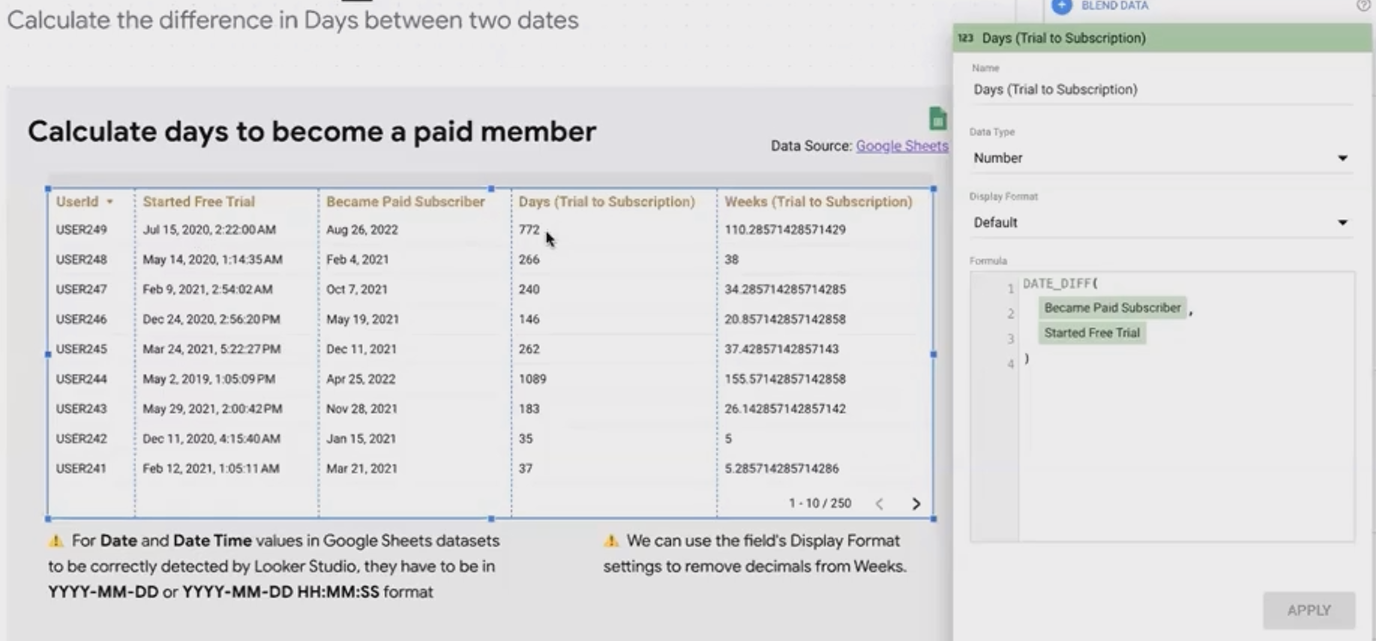
Calculate the exact duration between any two date fields in your data
Beyond Days: Converting to Weeks or Months
What if you want to see this data in weeks instead of days? Simply divide by 7:
DATE_DIFF(Became Paid Subscriber, Started Free Trial) / 7But there's a problem: this gives us decimal values that don't aggregate well. For clean data visualization, we need to round these values.
We can adjust the display format to show no decimals, but for proper aggregation in charts, we should use the ROUND() function:
ROUND(DATE_DIFF(Became Paid Subscriber, Started Free Trial) / 7, 0)Now we can create meaningful visualizations that show how many users converted in week 1, week 2, and so on.
Working with Current Dates Using TODAY()
What about analyzing data relative to the current date? That's where the TODAY() function comes in.
How TODAY() Works
The TODAY() function returns the current date (when the report is viewed). It takes no parameters:
TODAY()Practical Example: Membership Duration
For a subscription business, understanding how long customers have been subscribers is crucial. We can calculate this with:
DATE_DIFF(TODAY(), Became Paid Subscriber)This formula gives us the number of days each customer has been a subscriber as of today:
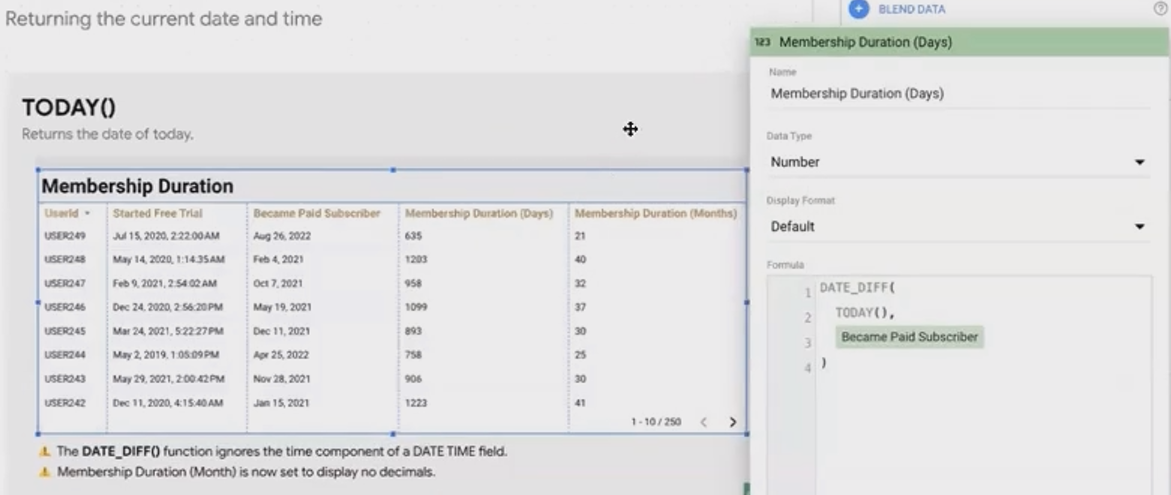
Calculate how long something has been active as of the current date
Creating Useful Visualizations with TODAY()
To analyze membership duration, we might want to group subscribers by how many months they've been with us. First, we convert days to months:
DATE_DIFF(TODAY(), Became Paid Subscriber) / 30Then, we round to create proper groupings:
ROUND(DATE_DIFF(TODAY(), Became Paid Subscriber) / 30, 0)Now we can create a bar chart showing membership duration per month:
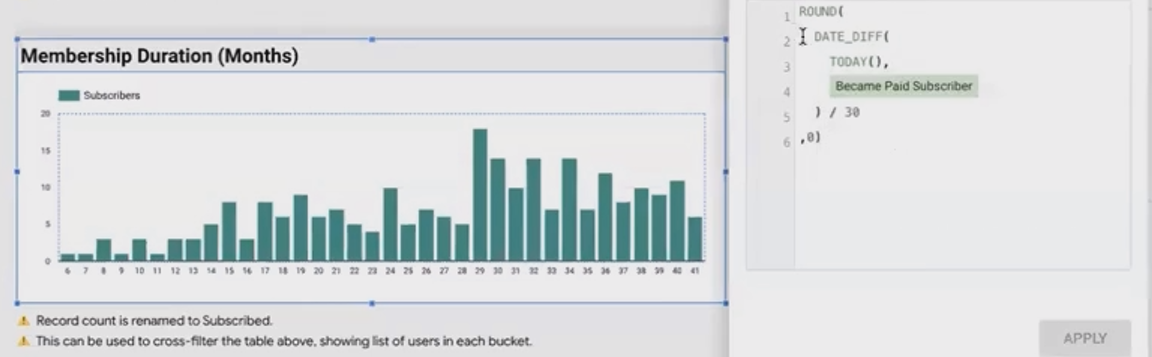
Visualizing the distribution of subscriber
Pro Tip: Enable Cross-Filtering
Make your report interactive by enabling cross-filtering. This allows users to click on a bar (e.g., "14-month subscribers") and immediately see all the users in that category in a detail table.
This takes your report from merely informative to truly analytical, enabling deeper investigation of patterns and anomalies.
Analyzing by Day of Week with WEEKDAY()
Want to know which day of the week drives the most conversions, purchases, or engagement? The WEEKDAY() function is your answer.
How WEEKDAY() Works
The WEEKDAY() function returns a number (0-6) representing the day of the week for a given date:
0 = Monday
1 = Tuesday
...
6 = Sunday
Its syntax is simple:
WEEKDAY(date)Practical Example: Subscription Day Analysis
To understand which day of the week generates the most paid subscriptions, we use:
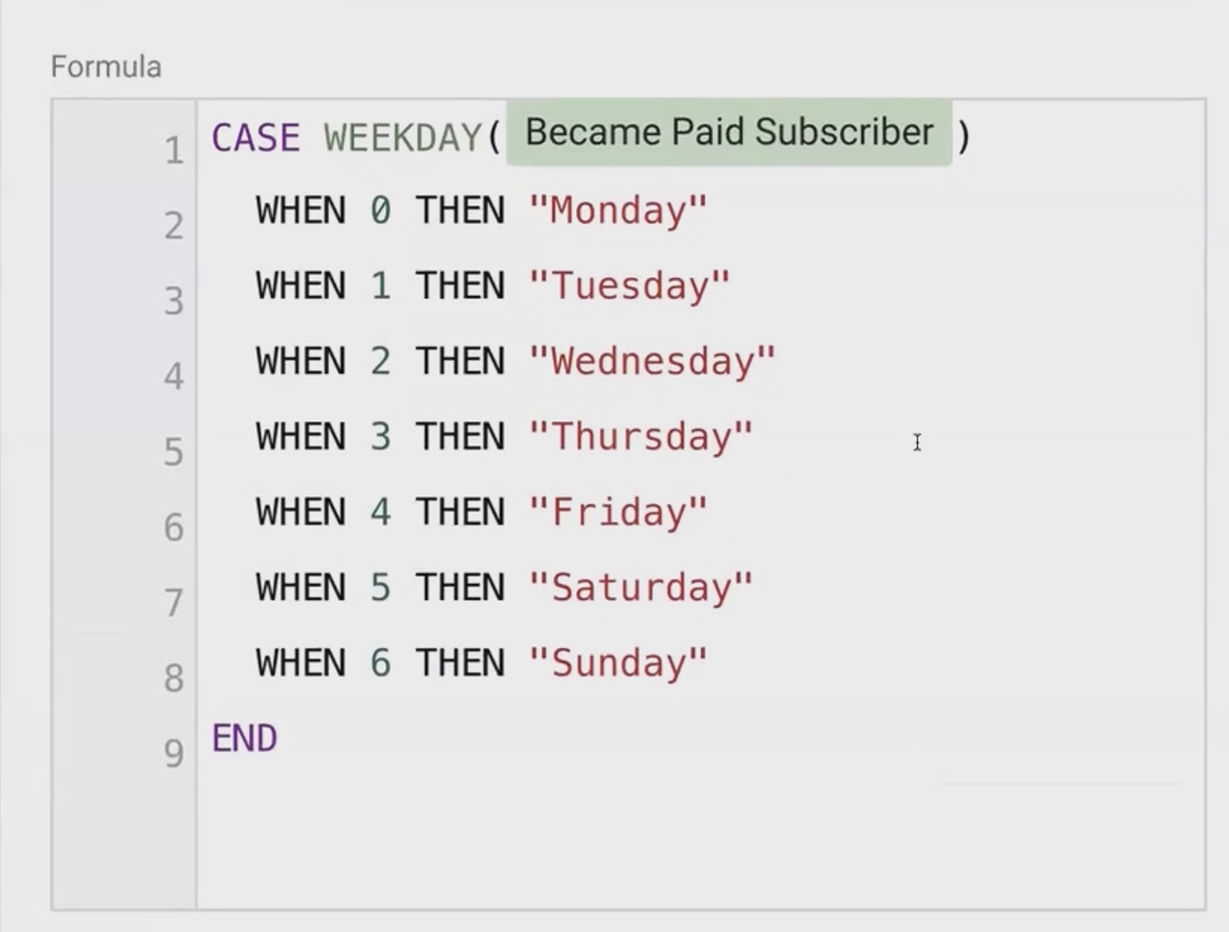
WEEKDAY(Became Paid Subscriber)But this gives us numbers, not day names. For better readability, we can convert these numbers to day names using a CASE statement:
CASE
  WHEN WEEKDAY(Became Paid Subscriber) = 0 THEN "Monday"
  WHEN WEEKDAY(Became Paid Subscriber) = 1 THEN "Tuesday"
  WHEN WEEKDAY(Became Paid Subscriber) = 2 THEN "Wednesday"
  WHEN WEEKDAY(Became Paid Subscriber) = 3 THEN "Thursday"
  WHEN WEEKDAY(Became Paid Subscriber) = 4 THEN "Friday"
  WHEN WEEKDAY(Became Paid Subscriber) = 5 THEN "Saturday"
  WHEN WEEKDAY(Became Paid Subscriber) = 6 THEN "Sunday"
END
Alternatively, we can use the simpler "simple case" syntax:
Grouping Days: Weekday vs. Weekend
Often, we want to analyze weekday vs. weekend performance. We can create this grouping with:
CASE
  WHEN WEEKDAY(Became Paid Subscriber) BETWEEN 0 AND 4 THEN "Weekday"
  ELSE "Weekend"
END
Now we can create visualizations comparing weekday and weekend performance.

Separating weekdays and weekends
The Normalization Trap
When comparing weekdays to weekends, be careful! Since weekdays include five days while weekends include only two, raw numbers will be misleading.
Instead, calculate the average per day type:
Total weekday conversions ÷ 5 = Average conversions per weekday
Total weekend conversions ÷ 2 = Average conversions per weekend day
This normalization provides a fair comparison that can reveal true performance patterns.
Frequently Asked Questions (FAQs)
My date calculations don't match what I expect. What could be wrong?
The most common issues with date calculations are:
Order of dates in DATE_DIFF() - Remember that the more recent date should come first.
Time zone differences - Looker Studio may use a different time zone than your data source.
Missing data - If certain dates have no data, they won't be included in calculations.
Can I sort my weekday chart by the actual day order (Monday to Sunday) instead of alphabetically?
Yes! Add a numeric prefix to your day names in your CASE statement:
CASE WEEKDAY(date)
  WHEN 0 THEN "1-Monday"
  WHEN 1 THEN "2-Tuesday"
  ...
END
This will sort your days in the correct sequence rather than alphabetically.
How can I analyze seasonal patterns (like comparing this month to the same month last year)?
Use the EXTRACT() function to pull out the month component from dates, then create calculations that compare metrics for the same month across different years. We'll cover EXTRACT() in detail in our next guide!
Mastering date functions in Looker Studio opens up powerful possibilities for time-based analysis. The three functions we've covered today: DATE_DIFF(), TODAY(), and WEEKDAY()form the foundation for calculating durations, analyzing current status, and identifying patterns across different days of the week.
By implementing these techniques, you'll transform your reports from static numbers into dynamic insights that reveal how your key metrics evolve over time.
Ready to take your Looker Studio skills to the next level? In our next guide, we'll explore more advanced date functions for extracting components, projecting future dates, and building sophisticated time-based analyses.
Note:
This post is based on a subject covered in the Looker Studio Masterclass Program. To learn more about Looker Studio Masterclass, click here.