
Master Looker Studio Data Sources: Embedded vs. Reusable Explained
In the world of data visualization, Looker Studio has emerged as a powerful, accessible tool for transforming raw data into compelling visual stories. But before you can create those eye-catching charts and insightful dashboards, you need to understand the foundation that makes it all possible: data sources. Think of data sources as the bridge between your raw data and your beautiful reports - without them, your Looker Studio canvas remains empty and lifeless.
Today, we're diving deep into the heart of what makes Looker Studio tick - specifically focusing on understanding data sources and how to effectively create and manage them. Whether you're brand new to Looker Studio or looking to level up your data source management skills, this guide will equip you with the knowledge to build a solid foundation for your reporting.
Understanding Data Sources: The Bridge Between Your Data and Reports
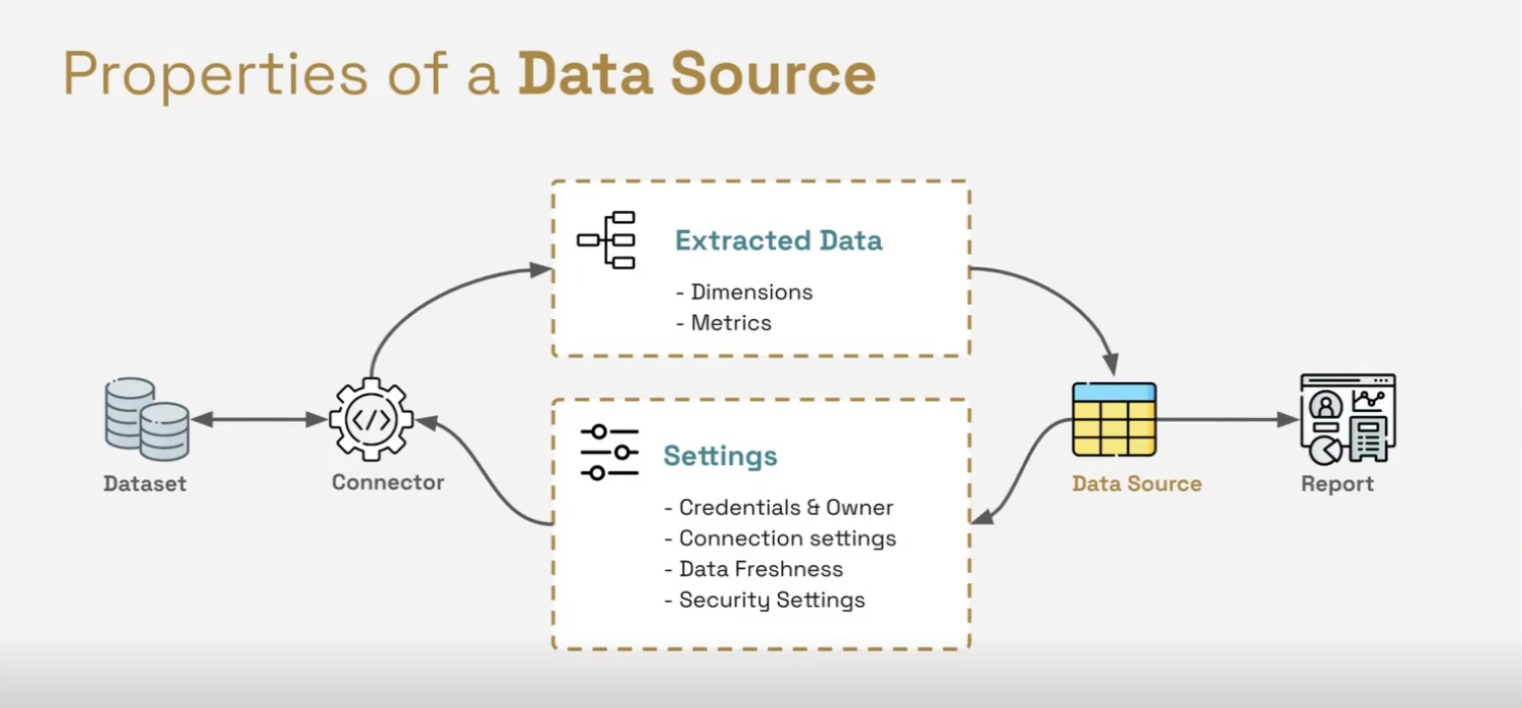
Properties of a Data Source
A data source in Looker Studio is much more than just a connection to your data. It's an asset that contains all the information needed to access, structure, and present your data in meaningful ways.
What Exactly Is a Data Source?
When you create a data source in Looker Studio, you're essentially establishing:
Connection Settings: Where your data lives (which Google Analytics property, which Google Sheet, which BigQuery table, etc.)
Credentials: Who owns the access to that data (your Google account, your client's account, etc.)
Field Structure: How your data is organized into dimensions (descriptive properties) and metrics (measurable values)
Fields: The Building Blocks of Your Data Source
Every data source in Looker Studio contains fields, which come in two main types:
Dimensions: The Descriptive Properties
Dimensions describe or categorize your data. They answer questions like:
What? (Product name, campaign name)
Who? (User type, customer segment)
Where? (Country, city, region)
When? (Date, time)
Dimensions typically appear as:
Text: Like product names, campaign names, or URLs
Dates: Like transaction dates or session dates
Geographic values: Like countries or cities
Boolean values: True/False fields like "Is Returning User"
Numbers (when not used for calculations): Like product IDs or the number of doors on a car
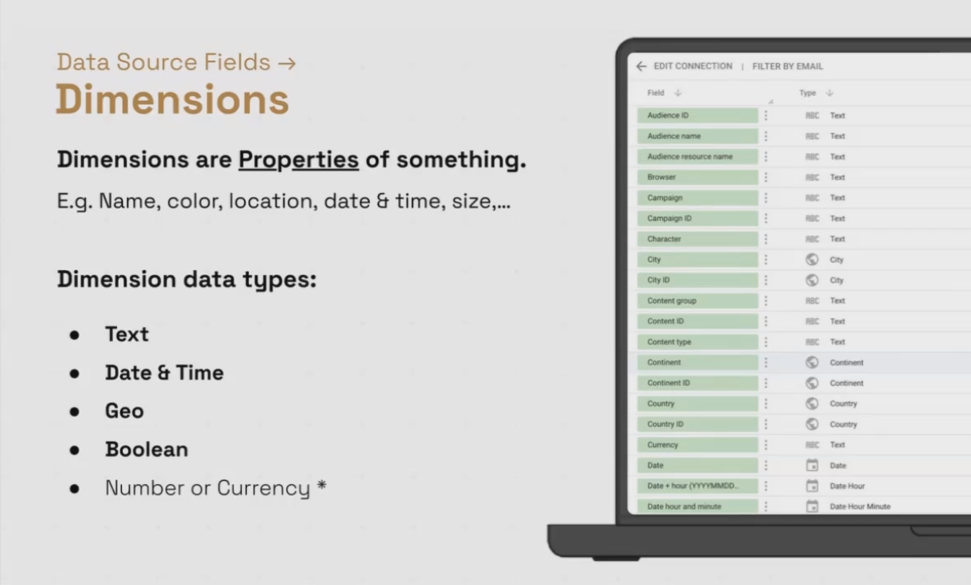
Dimensions in Looker Studio
Metrics: The Measurements
Metrics measure your dimensions. They answer questions like:
How many?
How much?
What's the average?
What's the percentage?
Metrics are always numerical and can be:
Simple numbers: Like session count or page views
Currency: Like revenue or cost
Percentages: Like conversion rate or bounce rate
Understanding the distinction between dimensions and metrics is crucial because they behave differently in reports. Dimensions typically go in rows, while metrics go in columns of tables. This distinction also affects how you can filter, sort, and visualize your data.
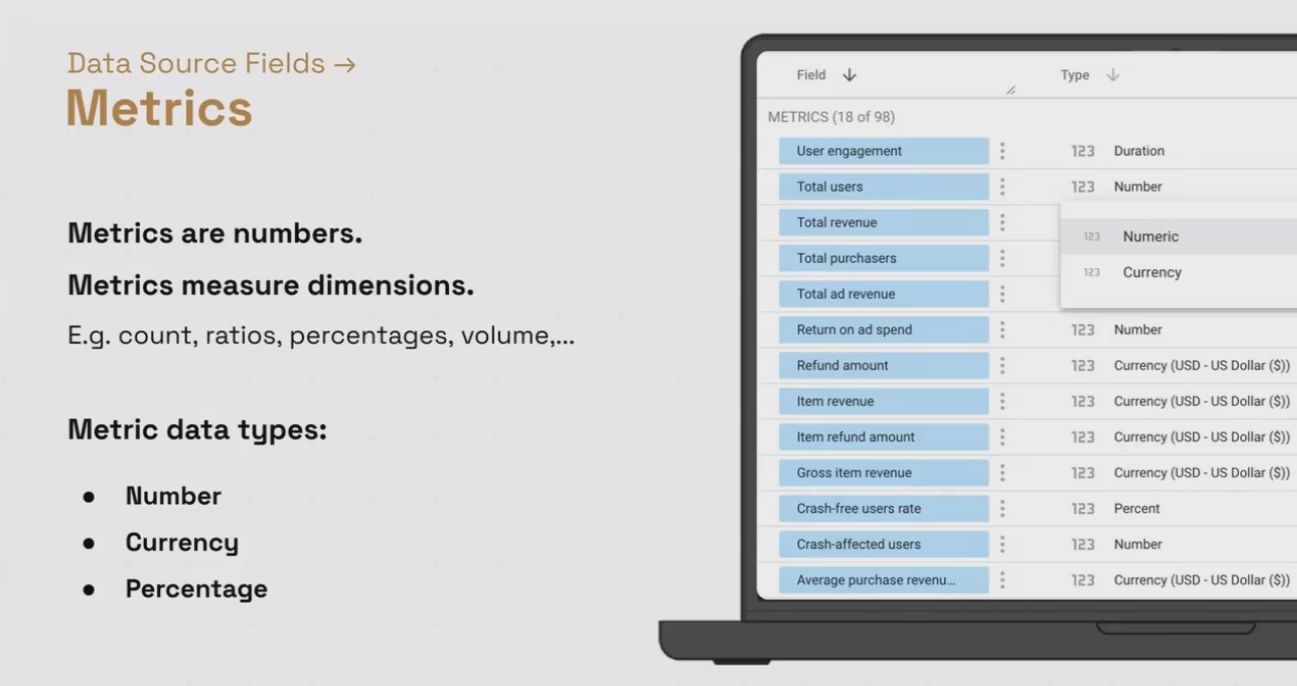
Metrics in Looker Studio
The Data Source Ecosystem in Looker Studio
One of the most powerful aspects of Looker Studio is its flexibility in connecting data sources to reports:
Multiple Data Sources in One Report: Unlike some other platforms that require one data source per report, Looker Studio lets you connect multiple data sources to different charts within the same report. This means you can have a Google Analytics chart next to a Google Ads chart next to a Shopify data chart, all within one cohesive dashboard.
One Data Source for Multiple Reports: Conversely, you can connect a single data source to multiple reports. This is particularly useful when you want to create different views of the same data for different audiences or purposes.

Flexibility in connecting Data Sources to Reports
The Two Types of Data Sources: Embedded vs. Reusable
In Looker Studio, data sources come in two different types, each with its own use cases and behaviors. Understanding the difference is critical for effective report management.
Embedded Data Sources: Local to Your Report
An embedded data source is created from within a report and only exists in that specific report. Think of it as a local asset that belongs exclusively to its parent report.
Key Characteristics of Embedded Data Sources:
Creation: Made from within a specific report
Scope: Local to that report only
Changes: Only affect the parent report
Storage: Not visible in your Looker Studio homepage "Data Sources" list
Duplication: When you copy the report, a new copy of the embedded data source is created
When to Use Embedded Data Sources:
For report-specific data needs
When you want to ensure changes to one report don't affect others
For simpler sharing and duplication processes
When working with data that only pertains to one specific report
Reusable Data Sources: Global Assets
A reusable data source exists independently of any report. It lives in your Looker Studio account and can be connected to multiple reports.
Key Characteristics of Reusable Data Sources:
Creation: Made from the Looker Studio homepage or converted from an embedded data source
Scope: Global to your Looker Studio account
Changes: Affect ALL reports connected to that data source
Storage: Visible in your Looker Studio homepage "Data Sources" list
Duplication: Copying a report creates a new reference to the SAME reusable data source (not a new copy)
When to Use Reusable Data Sources:
When you need consistent data definitions across multiple reports
For company-wide or team-wide data standards
When you want to update fields or calculations in one place and have it affect all related reports
For collaboration across large reporting ecosystems
The Reusable Data Source Cautionary Tale
Here's a real-world cautionary tale that illustrates the power (and potential pitfalls) of reusable data sources:
Early in my career, I created a Google Analytics report for Client A using a reusable data source. I spent countless hours creating calculated fields with complex business logic specific to that client.
Months later, Client B wanted a similar report. I duplicated Client A's report and tried to reconnect the reusable data source to Client B's Google Analytics account. Within an hour, I received a panicked email from Client A saying their numbers were completely wrong and charts were broken.
What happened? By changing the connection settings of the reusable data source to point to Client B's analytics account, I had inadvertently changed the data source for BOTH reports since they were sharing the same reusable data source!
The lesson: Be extremely careful when modifying reusable data sources. Understand that changes will propagate to all connected reports.
Creating and Managing Data Sources in Practice
Now that we understand the theory, let's look at how to create and manage data sources in Looker Studio.
Starting With a Blank Report
When you create a new blank report in Looker Studio, the first thing you'll be prompted to do is connect to data. This is because Looker Studio without data is essentially an empty canvas - all the functionality is disabled until you bring in some data.
Creating Your First Data Source
Here's how to create your first data source:
Click "Add data" from the blank report screen (or later from the Resource menu)
Choose a connector (e.g., Google Sheets, Google Analytics, BigQuery, etc.)
Configure the connection settings:
Select the specific data set (which Google Sheet, which GA property, etc.)
Verify or change the data credentials if needed
Click "Add" to create the data source and add it to your report
Once added, Looker Studio automatically creates a table with the data from your new data source. At this point, your data source is embedded in your report by default.
Managing Existing Data Sources
To manage data sources connected to your report:
Go to "Resource" in the top menu
Select "Manage added data sources"
This will show you all data sources connected to your report
From this screen you can:
Edit a data source (change fields, add calculations, etc.)
Rename a data source for clarity
See if a data source is embedded or reusable
Convert an embedded data source to reusable
Remove a data source from the report
Creating a Copy of a Report With Embedded Data Sources
When you duplicate a report that contains embedded data sources:
Click the three dots next to the report name and select "Make a copy"
Looker Studio will ask you to confirm which data sources to include in the copy
The new report will have its own independent copies of those embedded data sources
After copying, you can modify each embedded data source independently without affecting the original report.
Converting to a Reusable Data Source
If you've created an embedded data source but later decide you want to use it across multiple reports:
Go to "Resource" > "Manage added data sources"
Find your embedded data source
Click "Make reusable"
Decide whether to grant report editors access to edit the data source
Once converted to reusable, the data source will:
Appear in your Looker Studio homepage under "Data Sources"
Be available to add to other reports
Maintain a single version that, when edited, affects all connected reports
Remember: You cannot convert a reusable data source back to embedded. This is a one-way transformation.
Working With Reusable Data Sources Across Reports
To use an existing reusable data source in a new report:
Start a new report or go to an existing one
Click "Add data"
Select the "My data sources" tab
Choose your reusable data source from the list
Click "Add"
Now both reports are connected to the same data source. Any changes you make to the data source fields, calculations, or connection settings will affect both reports simultaneously.
Frequently Asked Questions (FAQs)
If I create a calculated field in an embedded data source and then copy the report, will that calculated field be in the new report's data source?
Yes! When you duplicate a report with an embedded data source, the entire data source - including all calculated fields, groups, and settings - is copied to the new report. But remember, from that point on, they are completely independent. Changes to one won't affect the other.
Is there a difference in report loading speed between embedded and reusable data sources?
No, there's no inherent performance difference between the two types. What affects performance more significantly is the type of connector you're using (live vs. warehoused), the complexity of your data, and how much data is being processed. Whether a data source is embedded or reusable doesn't impact how quickly it fetches and processes data.
When my access to a client's Google Analytics account expires, how should I set up their report so they can continue using it?
You have two main options:
Transfer ownership: Help the client duplicate the report and its data sources, then have them change the data credentials to their own.
Use viewer credentials: For some connectors (especially Google products), you can set the data source to use "Viewer's credentials" instead of "Owner's credentials." This means the report will use whoever is viewing it to authenticate with the data source, rather than using your credentials.
Is it possible to share filters between different reports, like creating reusable filters?
Currently, Looker Studio doesn't support "account-level" or "reusable" filters. Filters are tied to specific data sources and fields within them. If you need consistent filtering across multiple reports, your best option is to create similar filters in each report, or consider creating a filtered view at the data source level (if your connector supports that functionality).
Can I convert a reusable data source back to an embedded data source?
No, once you've converted a data source from embedded to reusable, you cannot convert it back. The conversion is a one-way process. If you need an embedded version again, you would need to create a new data source from scratch within the report.
Best Practices for Data Source Management
To wrap up, here are some best practices for managing your data sources in Looker Studio:
When to Use Embedded vs. Reusable Data Sources
Use embedded data sources when:
You're creating a one-off report
You're experimenting with calculations
You want to ensure changes don't affect other reports
You're creating client-specific reports with unique configurations
Use reusable data sources when:
You need consistency across multiple reports
You're building a reporting ecosystem for your organization
You have standard KPIs or calculations that should be uniform
Multiple team members are creating reports using the same data
Naming Conventions
Adopt clear naming conventions for your data sources:
Include the data origin (e.g., "GA4 - Website Traffic")
Indicate if it's for a specific client or purpose
Consider adding the date range if it's limited
Use prefixes or suffixes to indicate special properties
For example: "GA4 - E-commerce Data - Q2 2024 - With Custom Segments"
Documentation
Keep track of your data sources, especially as they grow in number:
Create a simple spreadsheet listing all your reusable data sources
Document what calculated fields exist in each
Note which reports are connected to each data source
Record who has access to edit each data source
This simple documentation step can save hours of troubleshooting later when you or your team are trying to understand how various reports are connected.
Understanding data sources is fundamental to mastering Looker Studio. By knowing when to use embedded versus reusable data sources and how to effectively manage them, you'll build more reliable, consistent, and maintainable reporting systems. In the next blog post, we'll explore how to transform your data within these data sources to generate even more powerful insights.
Remember: your reports are only as good as the data sources that power them. Take the time to set them up correctly, and your data visualization journey will be much smoother!
Note:
This post is based on a subject covered in the Looker Studio Masterclass Program. To learn more about Looker Studio Masterclass, click here.