
Looker Studio Connectors: Your Guide to Live vs. Warehoused Connectors
Are you tired of manually compiling marketing reports from multiple platforms? Ready to supercharge your data visualization workflow? Looker Studio's robust data connection capabilities might be exactly what you need. In this guide, we'll break down how to bring your valuable data into Looker Studio effectively, focusing on the types of connectors available and how to choose the right ones for your needs.
Whether you're a marketing specialist trying to visualize campaign performance, an analyst working with complex datasets, or a business owner seeking better insights, understanding Looker Studio's data connection options is your first step to creating powerful, insightful dashboards.
Understanding the Building Blocks: Data Connectors
Before you can create stunning visualizations in Looker Studio, you need to get your data into the platform. This is where data connectors come into play. Think of connectors as pipelines that extract information from your various data sources and bring it into Looker Studio where you can work with it.
What Do Data Connectors Actually Do?
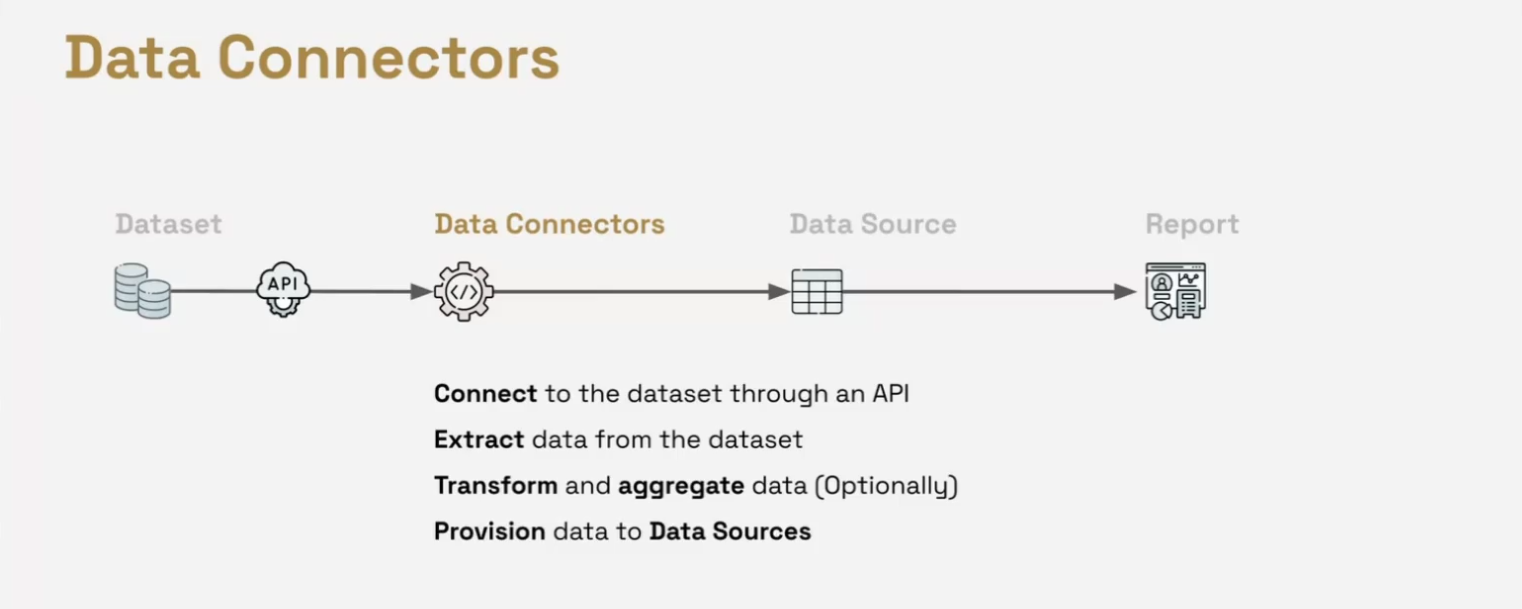
Data connectors serve three essential functions in your Looker Studio workflow:
API Connection: They establish a secure handshake with your data source's API
Data Extraction: They pull the raw numbers, text, and other information you need
Optional Transformation: Some connectors can pre-process or aggregate your data before it reaches Looker Studio
Without connectors, your data would remain trapped in its original platform, unusable for visualization. That's why understanding the types of connectors available—and their strengths and limitations—is crucial for effective reporting.
Functions of Data Connectors in Looker Studio
Google Connectors: The Native Options
Google provides a selection of native connectors that are integrated directly into Looker Studio. As of 2025, there are approximately 24 Google connectors available, covering most Google products and several common database types.
Key Characteristics of Google Connectors:
Free to use (though costs for the underlying data platform, like BigQuery queries, may still apply)
Built and maintained directly by Google
Primarily designed for Google products and generic databases
Mostly operate as Live connections (more on this distinction shortly!)
Popular Google Connectors You Should Know:
Google Analytics (GA4): Pull comprehensive web analytics data
Google Ads: Connect to single accounts or Manager accounts (MCC)
Google Search Console: Extract site or URL impression data across web, image, video, and news search types
YouTube Analytics: Analyze channel and video performance metrics
Google Sheets: A versatile option for working with spreadsheet data
BigQuery: Connect to tables or use custom SQL queries with BI Engine for enhanced speed
File Upload: For working with CSV files from your local drive
Extract Data: A special connector that can improve speed, security, and data handling
Database Connectors: Options for MySQL, PostgreSQL, Microsoft SQL Server, and Amazon Redshift
According to recent updates from Looker Studio's release notes, these connectors receive regular improvements to maintain compatibility with evolving APIs and to introduce new fields as they become available.
Partner Connectors: Expanding Your Horizons
While Google's connectors cover many needs, the real power of Looker Studio emerges when you consider the vast ecosystem of partner connectors. As of May 2025, there are over 900 partner connectors available, significantly expanding what data you can visualize.
Key Characteristics of Partner Connectors:
Mostly paid subscriptions (built and maintained by third parties as commercial products)
Connect to both Google and non-Google platforms (Facebook, Shopify, Klaviyo, etc.)
Can be either Live or Warehoused connections (an important distinction we'll explore next)
Often include advanced features not available in Google connectors
Notable Partner Connectors Worth Exploring:
Supermetrics: One of the most popular options with 140+ connectors
PowerMyAnalytics: Approximately 40+ connectors with warehouse connections
Funnel.io: Advanced transformation capabilities with multi-account roll-up
Analytics Canvas: Strong focus on GA4 and Google Ads with a visual transformation interface
Dataddo: Offers both live and warehouse connections with ETL capabilities
PortaMetrics: More cost-effective with a focused selection of connectors
Windsor.ai: Comprehensive marketing data integration
Coupler.io: Automated data pipelines for various sources
"According to a 2025 survey by Swydo, 73% of marketing agencies use at least one partner connector alongside Google's native connectors to create more comprehensive Looker Studio dashboards."
It's worth noting that most partner connectors offer additional data destinations beyond Looker Studio, such as BigQuery, Google Sheets, or even other visualization tools like Tableau and Power BI.
Live vs. Warehoused Connectors: Understanding the Flow and Impact
One of the most important concepts to understand when selecting data connectors is the distinction between live and warehoused connections. This difference significantly impacts your reports' performance, data freshness, and reliability.
Live Connectors: The Real-Time Approach
Live connectors operate exactly as their name suggests—they retrieve data in real-time when your dashboard loads.
How Live Connectors Work:
You or your client opens a Looker Studio dashboard
The dashboard requests data from the data source
The data source tells the connector to fetch fresh data
The connector makes a live API request to your data platform (Google Analytics, Facebook, etc.)
The data is returned, passed through the connector to the data source, and finally displayed in your charts
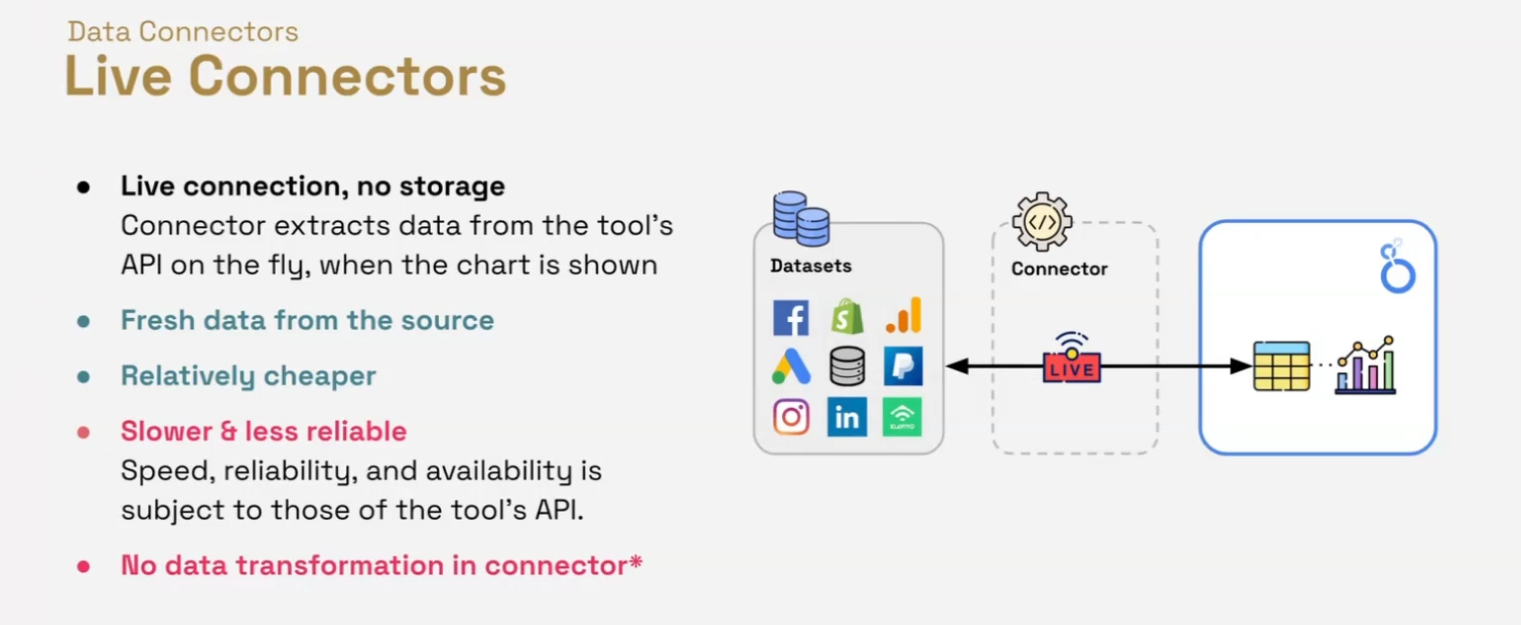
Key Attributes of Live Connectors:
No data storage: The connector doesn't store your data—it simply facilitates the connection
Always fresh data: You're seeing the most current information available in your source platform
Relatively more affordable: Less infrastructure needed by the connector provider means lower costs
Can be slower: Performance depends entirely on the source API's response time
Less reliable: If the source API is down or throttled, your dashboard might fail to load
Minimal transformation: To maintain speed, most live connectors do little to no data processing
Most Google connectors operate as live connectors by default, which is ideal for situations where real-time data is essential, but can become problematic for complex reports or slower APIs.
Live Connectors’ Definition, Pros and Cons
Warehoused Connectors: The Scheduled Sync Approach
Warehoused connectors take a fundamentally different approach to data retrieval.
How Warehoused Connectors Work:
On a schedule (hourly, daily, etc.), the connector extracts data from your source platform
This data is processed, transformed if needed, and stored in the connector provider's data warehouse
When you open your Looker Studio dashboard, it pulls data from this warehouse rather than directly from the source
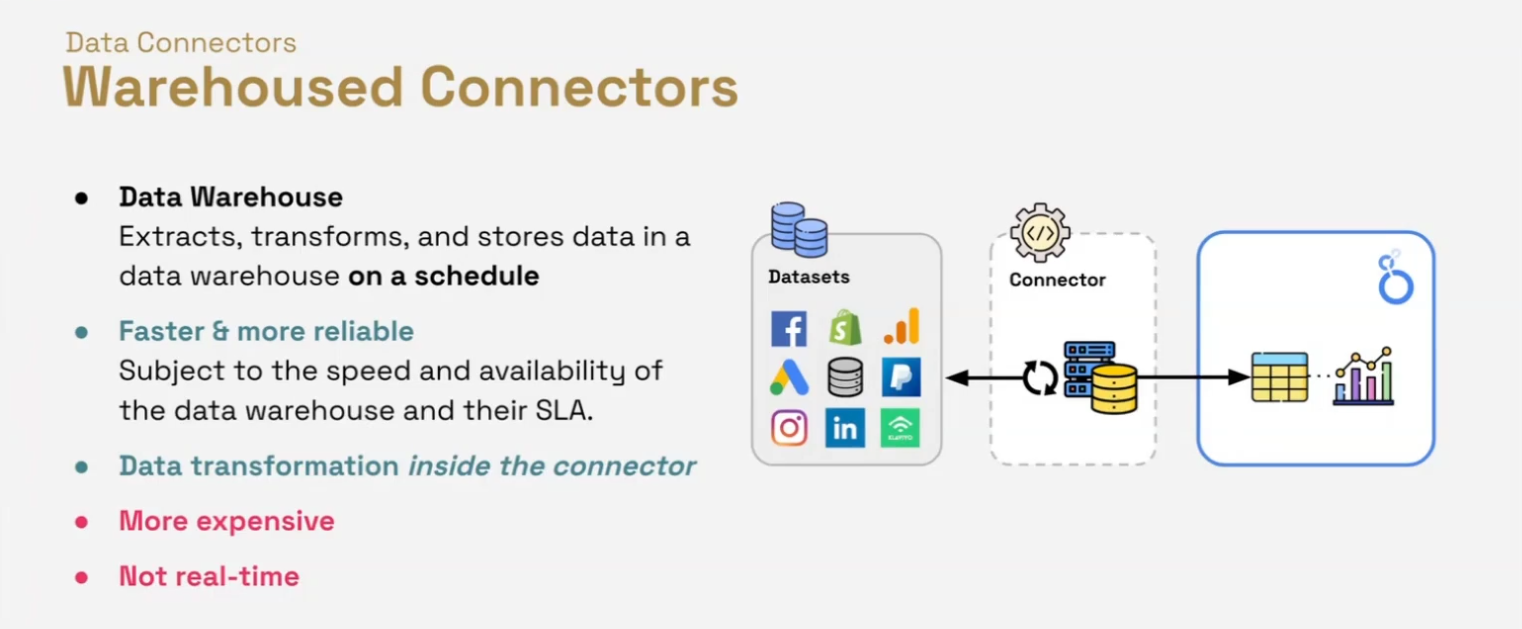
Key Attributes of Warehoused Connectors:
Faster dashboard performance: Data is pre-extracted and ready to serve
More reliable: Less dependent on source API availability during dashboard viewing
Not real-time: Data freshness depends on your sync schedule (hourly, daily, etc.)
Complex transformation possible: Since processing happens during the scheduled sync, more advanced data manipulations are feasible
Multi-account roll-up: Can extract and combine data from hundreds of accounts into a unified view
Generally more expensive: Storage and processing infrastructure increases costs
According to a recent report from Calibrate Analytics (February 2025), warehouse-based approaches like using BigQuery as an intermediary data layer can improve Looker Studio report load times by up to 80% compared to direct API connections.
Warehoused Connectors’ Definition, Pros and Cons
Making the Right Choice for Your Needs
The decision between live and warehoused connectors isn't always straightforward. Consider these factors:
Data freshness requirements: How current does your data need to be?
Report complexity: More complex reports benefit from warehoused connections
Budget considerations: Warehoused solutions typically cost more
Reliability needs: Critical business dashboards might warrant the stability of warehoused data
Transformation needs: Complex data processing points toward warehoused options
Many organizations end up using a hybrid approach—live connectors for simple, real-time metrics and warehoused connectors for complex, historical analysis.
A Closer Look at Notable Partner Connectors
Let's explore some of the leading partner connectors in more detail to understand their unique offerings and strengths:
Supermetrics
As one of the pioneers in the Looker Studio connector space, Supermetrics offers approximately 140+ data connectors covering virtually all major marketing platforms.
Key Features:
Mostly live connectors with intelligent caching for better performance
Often first-to-market with support for new API fields from major platforms
Multi-account roll-up capabilities
Additional data destinations including Google Sheets, BigQuery, and Excel
Strong integration with Google products
Supermetrics is particularly popular among marketing agencies that need to connect to multiple ad platforms and analytics tools. Their pricing model typically scales based on the number of data sources and connectors needed.
PowerMyAnalytics
With around 40+ connectors, PowerMyAnalytics offers warehouse connections that emphasize reliability and performance.
Key Features:
Warehouse-based architecture for consistent performance
Additional data destinations including API, FTP, Google Sheets, and BigQuery
Competitive pricing compared to some larger providers
Strong focus on marketing analytics platforms
PowerMyAnalytics has been gaining traction among mid-sized agencies looking for reliable performance without the premium price tag of some competitors.
Funnel.io
Funnel takes a warehouse-first approach with sophisticated built-in data transformation capabilities.
Key Features:
Primarily warehouse connectors
Advanced transformation interface with complex logic capabilities
Extensive roll-up properties for multi-account management
Numerous additional data destinations
Strong data governance features
While not the cheapest option, Funnel's strength lies in its transformation capabilities, making it popular for organizations with complex data modeling needs.
Analytics Canvas
Analytics Canvas has carved out a specialty focusing deeply on Google Analytics 4 and Google Ads data.
Key Features:
Built on Google Cloud infrastructure for speed with GA4 data
Powerful node-based visual transformation canvas
Multi-account roll-up capabilities
Additional destinations like Google Sheets, BigQuery, and Tableau
Specialized features designed specifically for GA4's data model
For organizations heavily invested in the Google ecosystem, Analytics Canvas offers specialized tools that can extract maximum value from GA4 data in particular.
PortaMetrics
While offering fewer connectors than some competitors, PortaMetrics focuses on cost-effectiveness.
Key Features:
Live connectors for major platforms
Google Sheets integration
More affordable pricing structure
Simplified interface
PortaMetrics appeals to smaller agencies and businesses that need essential connectivity without all the advanced features of premium providers.
Frequently Asked Questions (FAQs)
Here are answers to some common questions about data connectors in Looker Studio:
Is it possible to share filters between different reports, like creating reusable filters?
No, not in the sense of an "account-level reusable filter" object. Filters are inherently tied to the data source they are built upon because they reference specific fields within that data source. A filter like "State equals California" only makes sense if the data source has a "State" field. You'd need to recreate similar filter logic in other reports if needed.
Is there a difference in report loading speed between using embedded data sources and reusable data sources?
No, not inherently. The type of data source (embedded vs. reusable) doesn't directly impact load speed. Speed is primarily determined by the connector type (live vs. warehoused), the complexity of your queries, and the performance of the underlying data platform.
I'm considering switching from Supermetrics to PowerMyAnalytics. Does PowerMyAnalytics offer live connectors for real-time data?
Partner connector offerings evolve over time. While PowerMyAnalytics is known for its warehouse capabilities, they may offer live connections for specific platforms. It's best to check their latest offerings directly on their website or by contacting their support team for the most current information about their connector types.
Where can I find a list of all available calculated field formulas in Looker Studio?
Google provides comprehensive documentation for Looker Studio formulas. Search for "Looker Studio functions list" or "Looker Studio formulas" to find the official documentation detailing all text, date, aggregation, mathematical, and other functions available for calculated fields.
Can I show actual ad creatives (like banner images) in my Looker Studio reports alongside their performance data?
Yes, this is possible! Looker Studio has an "Image" field type and an IMAGE() function. If your data source contains URLs pointing directly to the ad creative images, you can use the IMAGE() function to create a field that displays these images in your tables.
The journey to powerful Looker Studio reports begins with choosing the right data connectors. Understanding the difference between Google's native connectors and the vast ecosystem of partner options is crucial, as is knowing when to use live versus warehoused connections.
For simple, real-time needs with Google products, native connectors often suffice. For complex, multi-platform reporting with advanced transformation requirements, partner connectors—particularly warehoused ones—typically deliver better results despite the additional cost.
Remember that the best connector choice depends on your specific requirements around data freshness, report complexity, and budget. The good news is that with over 900 options available as of 2025, you're likely to find the perfect fit for your unique data visualization needs.
Note:
This post is based on a subject covered in the Looker Studio Masterclass Program. To learn more about Looker Studio Masterclass, click here.