
BigQuery SQL Essentials: Data Analysis Examples and AI Query Generation Tips
In today's data-driven world, mastering SQL fundamentals and knowing how to efficiently use AI for query generation can dramatically improve your analytics workflow. This blog post explores practical data analysis examples using SQL in BigQuery and demonstrates how to effectively leverage AI tools to write complex queries.
From Basic SQL to Real-World Data Analysis
Once you've grasped the fundamentals of SQL (SELECT, FROM, WHERE, ORDER BY, and other core commands) it's time to apply those skills to real business problems. Let's explore how to transform raw order data into actionable customer insights using BigQuery.
Building a Customer Analytics Table
Imagine you're an analyst at an e-commerce company. Your marketing team wants to understand customer behavior to improve targeting and retention. You have access to an orders table, but you need to create a customer-centric view of the data.
Here's how we can transform order-level data into valuable customer insights:
SELECT
  customer_id,
  CONCAT(INITCAP(first_name), ' ', INITCAP(last_name)) AS customer_name,
  state AS customer_state,
  city AS customer_city,
  zip_code AS customer_zip,

  -- Lifetime Value Metrics
  SUM(revenue) AS customer_ltv,
  AVG(revenue) AS customer_aov,
  COUNT(DISTINCT order_id) AS frequency,

  -- Timeline Metrics
  MIN(order_date) AS first_order_date,
  MAX(order_date) AS last_order_date,
  DATE_DIFF(CURRENT_DATE(), MIN(order_date), DAY) AS customer_age_days,
  DATE_DIFF(CURRENT_DATE(), MAX(order_date), DAY) AS recency_days
FROM
  `looker-studio-masterclass.LSM_2024.online-store-orders`
GROUP BY
  1, 2, 3, 4, 5
ORDER BY
  frequency DESC
This query:
Cleans and formats customer names using text functions
Calculates key metrics like lifetime value (LTV) and purchase frequency
Determines when the customer first and last purchased
Computes metrics for customer age and recency
The power of this approach is that we've gone from transactional data (orders) to relationship data (customers). Now we can easily identify:
High-value customers by LTV
Most loyal customers by frequency
At-risk customers by examining recency
Visualizing Results Directly in Looker Studio
One of BigQuery's strengths is its seamless integration with Looker Studio. After running your analysis, click "Explore Data" to instantly visualize your results:
For city-level analysis, create a bar chart showing average customer LTV
To visualize geographic distribution, create a bubble map with:
Location: Concatenate city, state, and zip code
Bubble size: Customer LTV
Color: Purchase frequency
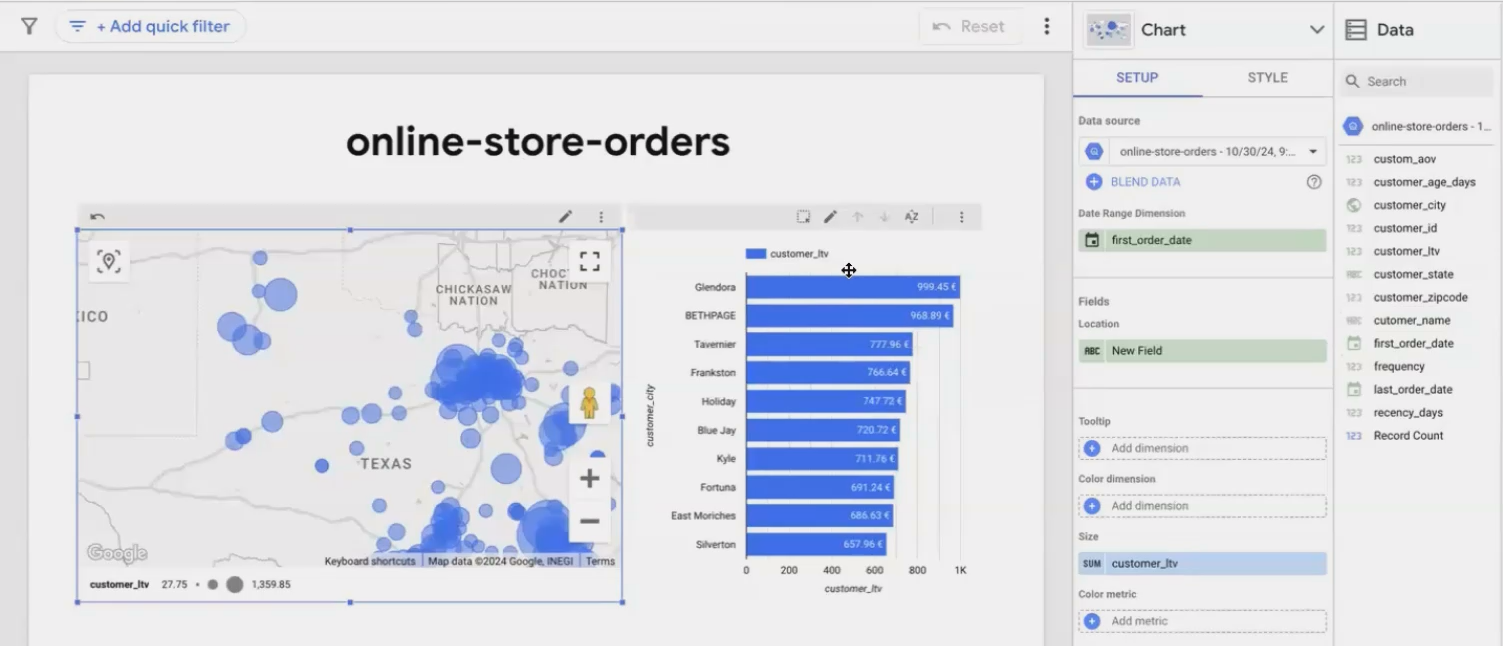
Visualizing customer concentration and value by location helps identify geographic targeting opportunities
This visualization makes it immediately apparent where your high-value customers are concentrated, providing actionable insights for regional marketing campaigns or expansion planning.
Leveraging AI for SQL Query Writing
Writing complex SQL queries can be time-consuming, especially when dealing with intricate business questions or unfamiliar database structures. AI tools like ChatGPT can significantly accelerate this process, but only if you use them effectively.
The Three-Part Formula for Effective AI Query Generation
To get reliable SQL from AI assistants, I follow a structured approach:
1. Provide Detailed Dataset Context
Before asking for a specific query, thoroughly explain your data structure:
I have a table in BigQuery with information about online store orders.
The table contains customer details (ID, name, location), order information
(date, ID, channel), product details, and revenue figures.
2. Share Sample Data
AI works best when it can "see" your actual data patterns. Use a LIMIT query to grab a small sample:
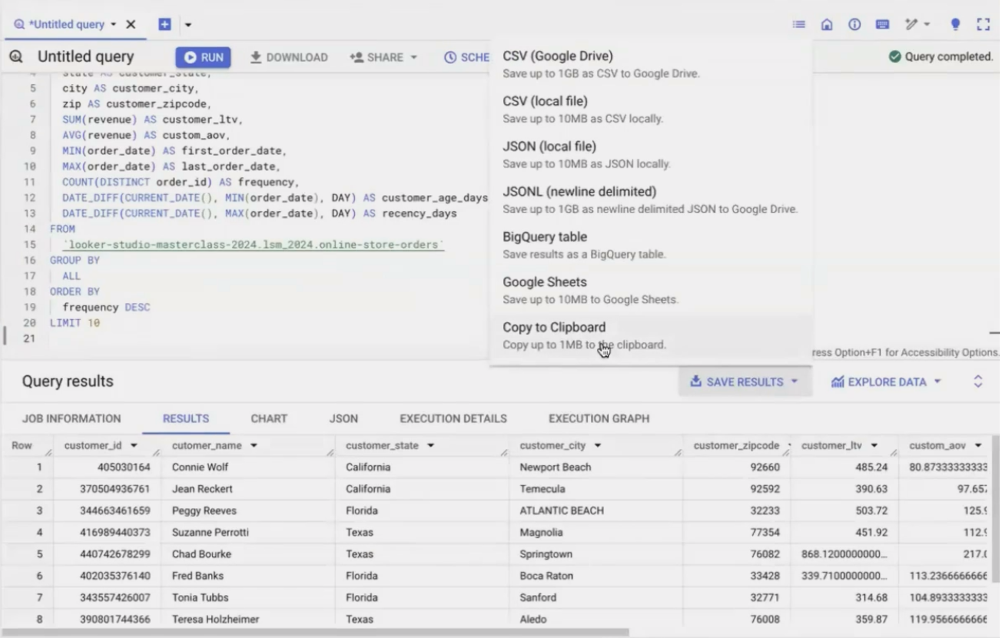
Then copy the results into your AI prompt. This helps the AI understand data formats, values, and patterns.
3. Include the Table Schema
BigQuery lets you copy the JSON schema of your table, which precisely defines column names and data types:
[
  {"name": "order_date", "type": "DATE"},
  {"name": "customer_id", "type": "INTEGER"},
  {"name": "first_name", "type": "STRING"},
  ...
]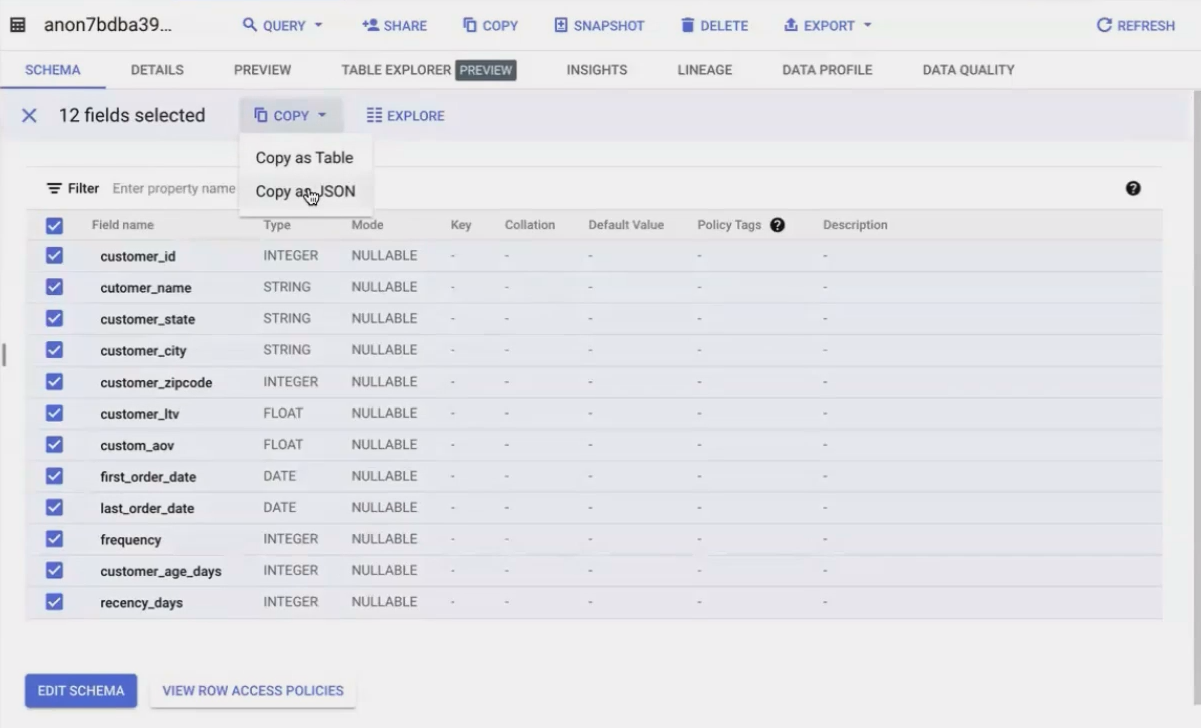
Including this in your prompt dramatically reduces the chance of syntax errors in the generated SQL.
RFM Analysis Example
Let's see this in action by asking for an RFM (Recency, Frequency, Monetary) analysis which is a common customer segmentation technique.
After providing the three pieces of context above, I asked:
Please give me the full SQL to run in BigQuery for an RFM analysis of this customer data.
I want to segment customers based on recency, frequency, and monetary value.
The AI generated a comprehensive query using the NTILE function (which divides data into equal groups):
WITH rfm_scores AS (
  SELECT
    customer_id,
    cutomer_name,
    -- Recency Score (lower is more recent)
    NTILE(5) OVER (ORDER BY DATE_DIFF(CURRENT_DATE(), MAX(order_date), DAY)) AS recency_score,
    -- Frequency Score (higher is more frequent)
    NTILE(5) OVER (ORDER BY COUNT(DISTINCT order_id) DESC) AS frequency_score,
    -- Monetary Score (higher is more valuable)
    NTILE(5) OVER (ORDER BY SUM(revenue) DESC) AS monetary_score,
    -- Additional data for analysis
    DATE_DIFF(CURRENT_DATE(), MAX(order_date), DAY) AS recency,
    COUNT(DISTINCT order_id) AS frequency,
    SUM(revenue) AS monetary
  FROM
    `looker-studio-masterclass.LSM_2024.online-store-orders`
  GROUP BY
    customer_id, cutomer_name
)
SELECT
  *,
  -- Calculate combined RFM score (scale of 3-15)
  recency_score + frequency_score + monetary_score AS rfm_score,
  -- Segment customers based on combined score
  CASE
    WHEN recency_score + frequency_score + monetary_score >= 13 THEN 'Champions'
    WHEN recency_score + frequency_score + monetary_score >= 10 THEN 'Loyal Customers'
    WHEN recency_score + frequency_score + monetary_score >= 7 THEN 'Potential Loyalists'
    WHEN recency_score + frequency_score + monetary_score >= 5 THEN 'At Risk'
    ELSE 'Needs Attention'
  END AS customer_segment
FROM
  rfm_scores
ORDER BY
  rfm_score DESC
This query introduces several advanced SQL concepts:
Common Table Expressions (CTEs) - The
WITHclause creates a temporary result setWindow Functions -
NTILE()andOVER()divide customers into equal segmentsCase Statements - Creating meaningful segments based on score ranges
Verifying AI-Generated SQL
While AI can generate impressive queries, always verify what it produces. When the AI used NTILE() (a function I wasn't familiar with), I asked for an explanation:
"What is NTILE? Could you explain how it works in this query?"
The AI explained that NTILE is a window function that divides rows into approximately equal ranked groups. In our case, it creates quintiles (5 groups) for each RFM dimension, with 1 being the lowest and 5 being the highest.
This verification step is critical. Never use AI-generated code you don't understand. View AI as a collaborative partner that drafts code and explains concepts, not as a replacement for your judgment.
Making SQL and AI Work Together in Your Analytics Workflow
The real power comes from combining traditional SQL skills with AI assistance. Here's how to integrate them effectively:
When to Use AI for SQL Generation
AI excels at:
Drafting complex queries when you know what you want but aren't sure of the syntax
Explaining unfamiliar SQL concepts or functions
Troubleshooting errors in existing queries
Optimizing query performance by suggesting improvements
However, AI should complement, not replace, your SQL knowledge. Understanding the fundamentals ensures you can verify the AI's output and make necessary adjustments.
Best Practices for AI-Assisted SQL Development
Start with a clear question: The more specific your request, the better the AI's response
Always provide context: Include sample data and schema information
Build incrementally: Start with simple queries and add complexity gradually
Verify and understand: Never use code you don't understand
Learn from the AI: Use AI explanations to expand your SQL knowledge
By following these practices, you'll create a virtuous cycle where each AI interaction improves both your immediate productivity and your long-term SQL proficiency.
Frequently Asked Questions (FAQs)
Can I trust AI-generated SQL for production use?
AI-generated SQL should always be reviewed before production use. While AI tools have improved dramatically, they can still make mistakes, especially with complex database schemas or edge cases. Consider AI a "first draft" that needs your expert review.
What if I don't know enough SQL to verify the AI's output?
Focus on learning SQL fundamentals first. Once you understand basic query structure and logic, you can more effectively use AI as a learning tool. Ask the AI to explain its code in detail, and gradually build your verification skills.
How do I handle when the AI generates SQL with syntax or logical errors?
When errors occur, provide the error message back to the AI and ask for corrections. This iterative process often results in working code and helps you understand common pitfalls. For persistent issues, break down your request into smaller parts.
Do different AI models produce different quality SQL?
Yes, more advanced models like GPT-4 typically produce more accurate and optimized SQL than earlier versions. Specialized SQL-focused AI tools may also outperform general-purpose AI in certain scenarios. If possible, test multiple options to find what works best for your needs.
Is it better to write SQL manually or use AI?
The best approach combines both. Write simple queries manually to maintain your skills, and use AI for complex scenarios or when exploring unfamiliar territory. This hybrid approach maximizes productivity while ensuring you maintain control over your data analysis process.
By mastering SQL fundamentals and strategically leveraging AI assistance, you can dramatically accelerate your data analysis workflows. The combination gives you the best of both worlds: the precision and control of hand-crafted SQL with the efficiency and innovation potential of AI collaboration.
Remember that tools like BigQuery and AI assistants are meant to augment your analytical capabilities, not replace your critical thinking. The most powerful analytics comes from combining technological tools with human insight and domain expertise.
Note:
This post is based on a subject covered in the Looker Studio Masterclass Program. To learn more about Looker Studio Masterclass, click here.