
How to Use Looker Studio's Conversational Analytics: Transform Data Exploration with AI
Ever wished you could just talk to your data? That's exactly what Conversational Analytics in Looker Studio enables a powerful feature that transforms how we interact with our dashboards. In this deep dive, I'll walk you through this game-changing Gemini AI-powered capability that's reshaping data visualization as we know it.
What is Conversational Analytics?
Conversational Analytics is a Looker Studio Pro feature powered by Google's Gemini AI that allows you to interact with your data using natural language. Instead of building complex formulas or dragging and dropping fields, you simply ask questions in plain English, and the AI generates visualizations for you.
Think of it as having a data analyst assistant who understands both your questions and your data, ready to create charts and tables on demand.

The Conversational Analytics panel allows you to simply type questions about your data and receive instant visualizations.
Starting a Conversation with Your Data
Connecting Your Data Source
Before diving into natural language queries, you'll need to connect Conversational Analytics to your data. Here's how:
In Looker Studio, find the Conversational Analytics panel in the sidebar
Click "Connect to new data"
Choose your data source:
BigQuery tables or views
Google Sheets
Looker (the BI tool)
CSV files you upload
Extracted data from other connectors
Unfortunately, you can't currently chat directly with Google Analytics data. However, if you extract that data first, you can then use Conversational Analytics with the extracted version.
Once connected, your data becomes available for natural language querying. The system will even suggest sample questions based on your data structure!
From Question to Visualization: The Magic in Action
Let's see this in action with a real example. Imagine we have connected our e-commerce customer lifetime value (LTV) dataset that contains transaction information, including dates, revenue, and customer locations.
Example Query: Cohort Analysis by Acquisition Date
Let's say we want to understand how customer behavior varies by when they were acquired. We might type:
What's the average number of transactions per acquisition cohort in year quarter?Within seconds, Conversational Analytics processes this request and generates a visualization, typically a line chart showing the trend of average transactions across quarterly cohorts.
Understanding the "How" Behind the Magic
One of the most powerful aspects of this feature is transparency. After generating a chart, you can click "How was this calculated?" to see exactly what happened behind the scenes:
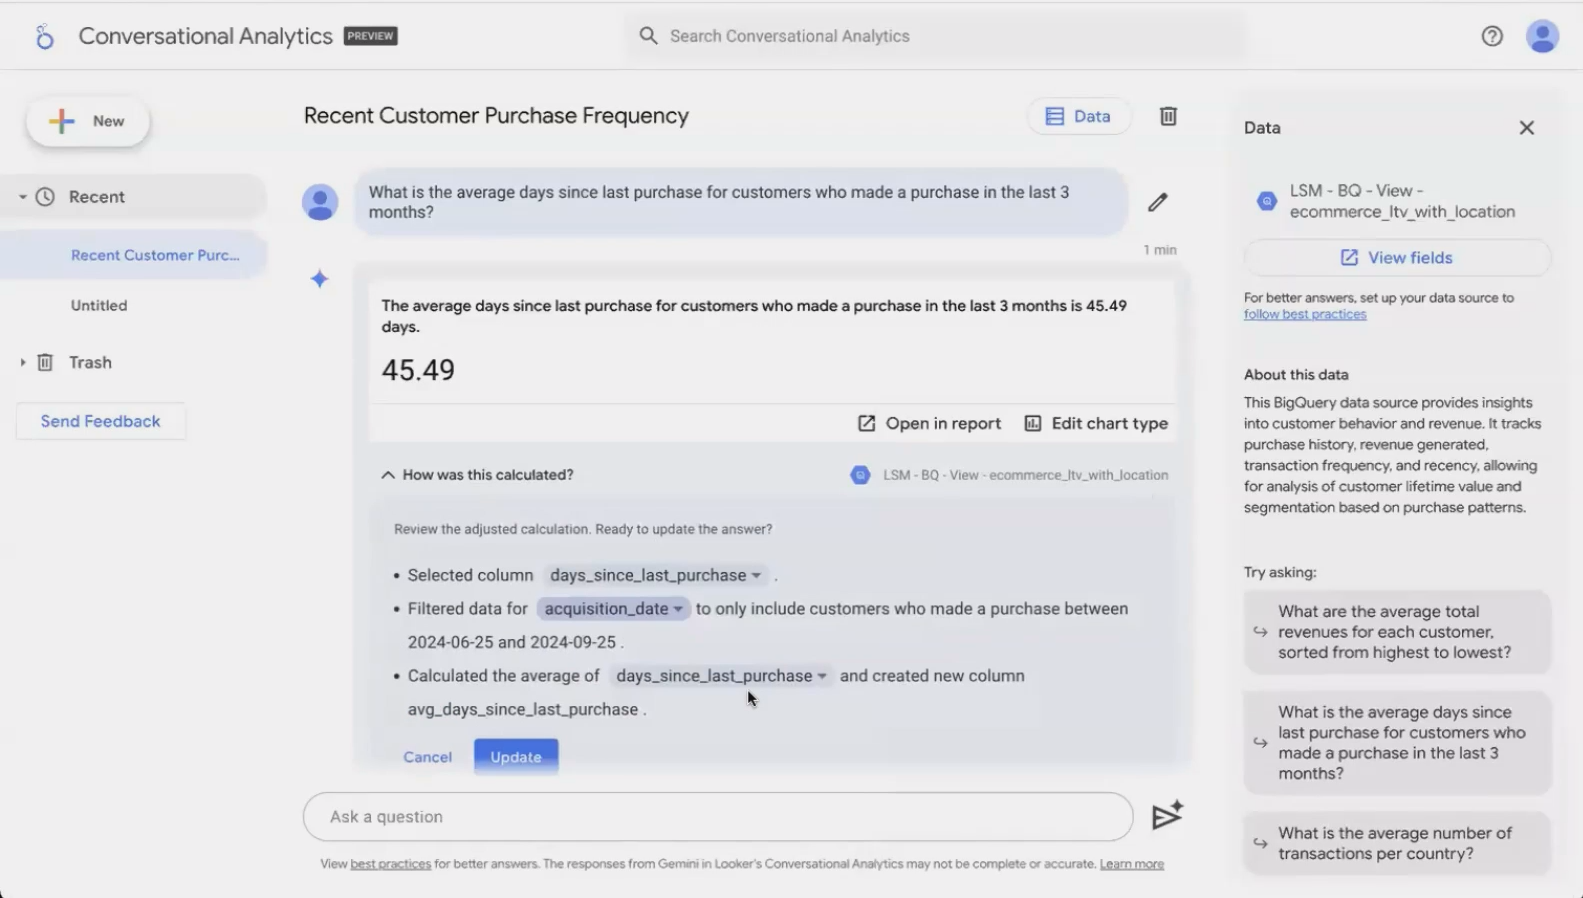
The transparency feature reveals exactly how Conversational Analytics interpreted your question and processed the data.
In our example, it would show something like:
Selected fields:
acquisition_dateandnumber_of_transactionsCreated a derived field:
acquisition_quarterby truncating dates to quarterly periodsCalculated the average of
number_of_transactionsfor each quarterSorted results chronologically
This transparency is crucial for maintaining trust in AI-generated analytics and helps you learn how the system interprets different types of questions.
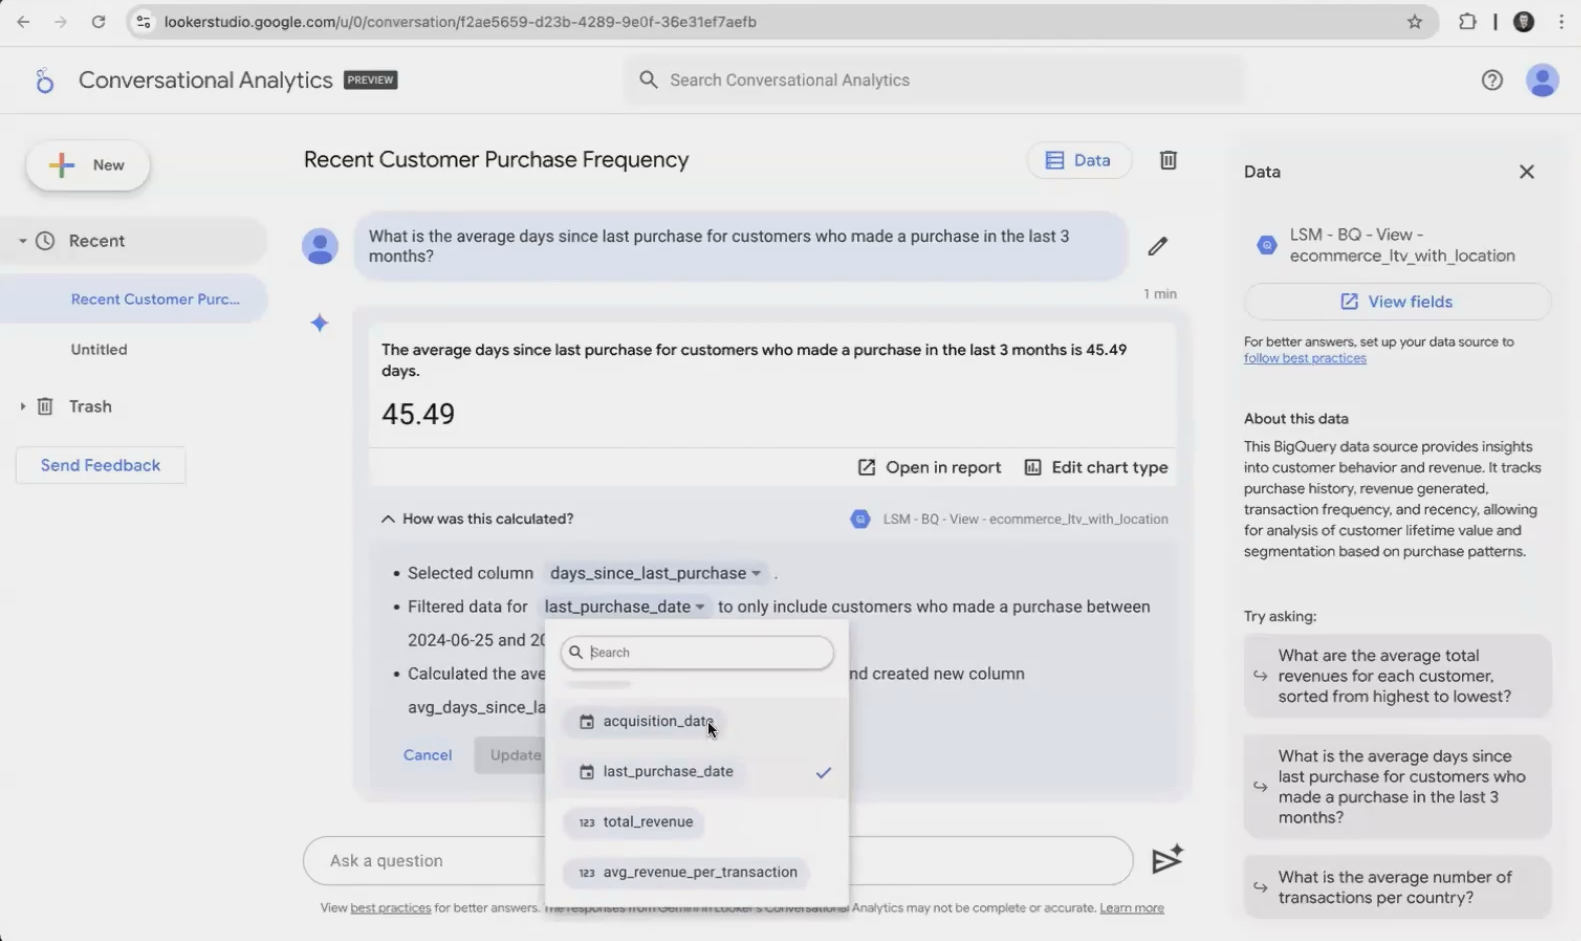
Refining Your Results
Not happy with the initial result? No problem. Conversational Analytics offers several ways to refine your visualizations:
1. Editing the Logic
If you notice the AI misunderstood part of your request (perhaps filtering on the wrong date field), you can edit the underlying logic. Click "Edit" below the "How was this calculated?" section to modify fields, calculations, or filters without starting over.
2. Changing the Chart Type
Maybe the line chart doesn't best represent your data? Simply click "Edit chart type" to switch between visualizations:
Bar charts (vertical or horizontal)
Line charts
Tables
Pie or donut charts
3. AI-Generated Insights
A particularly valuable feature is the "Insights" section that appears with many visualizations. This uses Gemini AI to analyze patterns in your data and provide bullet-point observations.
For example, with geographical data, it might note:
"Average transactions vary significantly across cities"
"Smaller cities tend to have higher average transaction counts"
"Coastal regions show different patterns than inland areas"
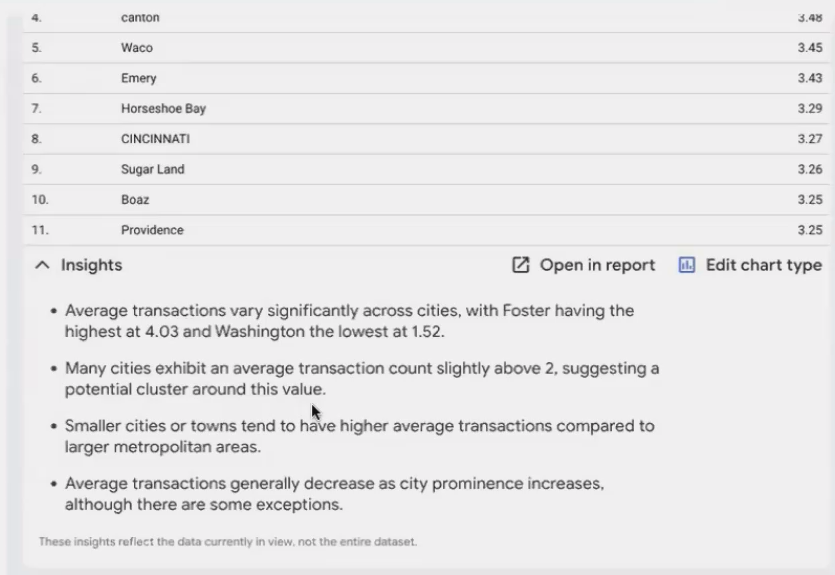
While these insights can spark new ideas for analysis, remember to verify them against your business knowledge. The AI doesn't know your business context.
From Chat to Report: Integrating Your Discoveries
Once you've refined your visualization to perfection, you can add it to your report just by clicking on “Open in Report“.

This seamless workflow allows you to rapidly build complex dashboards through conversation, then fine-tune them with traditional tools.
Real-World Applications
Conversational Analytics truly shines when exploring unfamiliar datasets or conducting ad-hoc analysis. Here are some practical scenarios where it excels:
Initial data exploration: Quickly understand what's in your dataset by asking broad questions
Executive meetings: Answer unexpected questions on the fly without pre-building every potential chart
Hypothesis testing: Rapidly test different ways of looking at your data without technical setup
Teaching data literacy: Help non-technical stakeholders engage with data through natural language
Limitations to Be Aware Of
While powerful, Conversational Analytics isn't without limitations:
Data blending: Currently, you can only chat with one data source at a time
Complex calculations: Very intricate analyses might still require traditional methods
Natural language understanding: Occasionally misinterprets complex or ambiguous requests
Pro subscription required: This feature is only available with Looker Studio Pro ($9/month)
Frequently Asked Questions (FAQs)
Do all my team members need a Pro license to view reports with Conversational Analytics?
No, only the report creator needs a Pro license. Anyone viewing the final report doesn't need Pro. They'll see the charts you created, but won't be able to use the conversation feature themselves.
Can I use Conversational Analytics with my Google Analytics 4 data?
Not directly. You need to first extract GA4 data to another source (like BigQuery or a Google Sheet), then connect Conversational Analytics to that extracted data.
How accurate are the AI-generated insights?
The insights function provides interesting starting points for analysis but should always be verified. The AI doesn't know your business context or data collection methodology, so treat insights as hypotheses rather than conclusions.
Is my data secure when using Conversational Analytics?
Yes, Conversational Analytics follows Google Cloud's security and privacy standards. Your data remains within your Google Cloud environment and isn't shared with external systems.
The beauty of Conversational Analytics is that it requires minimal setup. If you have Looker Studio Pro, you can start using it immediately with your existing data sources. It's an ideal feature for:
Data analysts looking to accelerate their workflow
Business users who need insights but lack technical skills
Dashboard creators who want to rapidly prototype visualizations
Conversational Analytics represents a significant shift in how we interact with data tools by moving from technical interfaces to natural conversation. It democratizes access to insights while maintaining the depth and power Looker Studio is known for.
As AI continues to evolve, features like this will likely become standard across analytics platforms. By mastering Conversational Analytics today, you're not just learning a feature; you're preparing for the future of data interaction.
Note:
This post is based on a subject covered in the Looker Studio Masterclass Program. To learn more about Looker Studio Masterclass, click here.