
Looker Studio CASE Function: The Ultimate Guide
Welcome to one of the most powerful aspects of Looker Studio's data transformation capabilities! In today's exploration, we'll dive into the CASE function – a versatile tool that will transform how you organize, categorize, and present your data.
If you've been working with data in Looker Studio, you've likely faced situations where you needed to go beyond simple filters and create meaningful groups from your raw data. Perhaps you wanted to segment customers into value tiers, categorize products by performance, or consolidate fragmented source data into clean, actionable insights. The CASE function is your solution for these challenges and much more.
In this comprehensive guide, we'll explore every aspect of the CASE function – from its basic structure to advanced implementations that will help you create dynamic, responsive, and insightful reports. Let's dive in!
The Anatomy of CASE: Understanding the Basics
The CASE function allows you to evaluate multiple conditions and return specific values based on which condition is met first. Unlike the IF function, which is limited to a simple "if this, then that, otherwise something else" structure, CASE lets you define as many conditions and outcomes as you need.
Here's the basic structure of a CASE function:
CASE
    WHEN condition1 THEN result1
    WHEN condition2 THEN result2
    [WHEN conditionX THEN resultX...]
    [ELSE default_result]
END
Let's break this down:
CASE: Signals the start of the function
WHEN: Introduces a condition to evaluate
THEN: Specifies what to return if the condition is true
ELSE: (Optional) Provides a default value if no conditions are met
END: Marks the end of the function
Each condition is evaluated in order, and the function returns the result associated with the first condition that evaluates to true. If no conditions are met and no ELSE clause is provided, the function returns NULL.
Evaluating Conditions: Practical Applications
Let's explore how to use CASE in real-world scenarios:
Numeric Value Bucketing
One common use of CASE is to group numeric values into meaningful categories. For example, if you're analyzing keyword performance in Google Search Console, you might want to categorize positions:
CASE
    WHEN Average Position <= 3 THEN "Top 3"
    WHEN Average Position < 10 THEN "4-10"
    ELSE "10+"
END
This creates three distinct categories: high-performing keywords (positions 1-3), moderately performing keywords (positions 4-9), and lower-performing keywords (position 10 and beyond).
Multi-Condition Text Categorization
CASE is excellent for categorizing text fields based on multiple values. For instance, if you're analyzing global traffic, you might want to group countries into markets:
CASE
    WHEN Country IN ("United States", "Canada", "Mexico") THEN "Americas"
    WHEN Country IN ("Japan", "China", "India", "South Korea") THEN "Asia"
    WHEN Country IN ("Germany", "France", "United Kingdom", "Spain") THEN "Europe"
    ELSE "Not in Served Markets"
END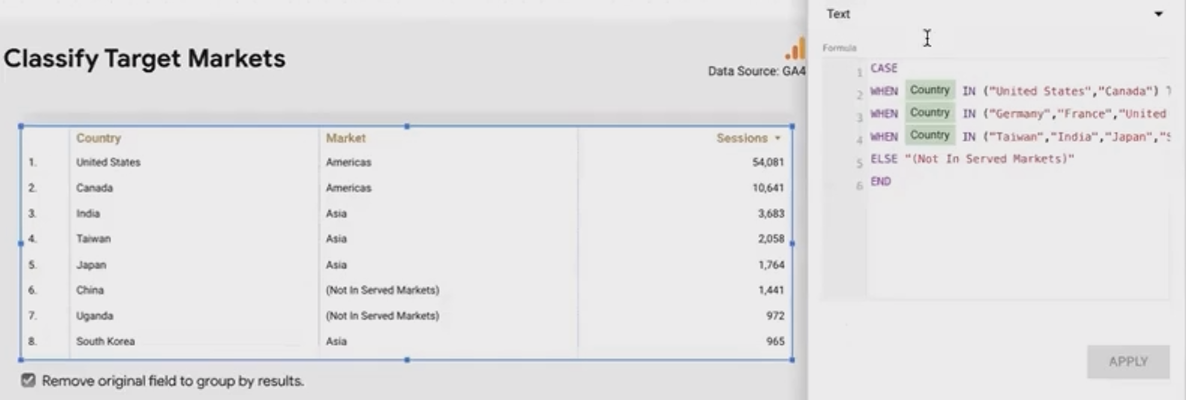
This consolidates your country-level data into broader market regions, making high-level analysis more manageable.
Customer Segmentation
For businesses with customer data, segmenting based on value metrics is crucial:
CASE
    WHEN LTV >= 500 THEN "High Value Customer"
    WHEN LTV >= 250 THEN "Mid Value Customer"
    ELSE "Low Value Customer"
END
This simple segmentation can drive different marketing strategies and investment levels across your customer base.
Date-Based Grouping
Time-based analysis often requires grouping dates into meaningful periods:
CASE
    WHEN WEEKDAY(Date) < 5 THEN "Weekday"
    ELSE "Weekend"
END
This assumes a WEEKDAY() function where Monday=0 through Sunday=6, creating a simple weekday/weekend split that can reveal important patterns in your data.
The Critical Importance of WHEN Clause Order
One of the most important aspects of the CASE function to understand is that the order of your WHEN clauses matters tremendously. The function evaluates conditions sequentially and returns the result for the first true condition it encounters.
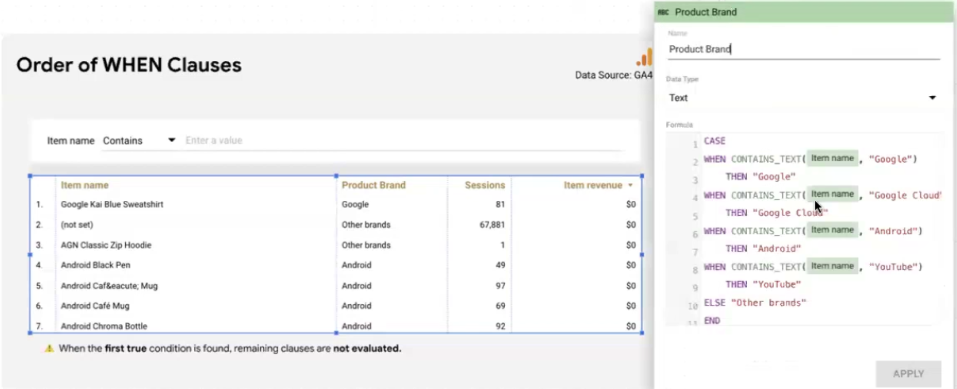
Consider this example where we're trying to categorize products by brand:
CASE
    WHEN CONTAINS_TEXT(Item Name, "Google") THEN "Google"
    WHEN CONTAINS_TEXT(Item Name, "Google Cloud") THEN "Google Cloud"
    WHEN CONTAINS_TEXT(Item Name, "YouTube") THEN "YouTube"
    ELSE "Other Brand"
END
This looks logical at first glance, but there's a critical flaw: Any product containing "Google Cloud" in its name also contains "Google" – meaning it will be categorized as "Google" because that condition comes first and evaluates to true.
The correct approach is to order your conditions from most specific to most generic:
CASE
    WHEN CONTAINS_TEXT(Item Name, "Google Cloud") THEN "Google Cloud"
    WHEN CONTAINS_TEXT(Item Name, "Google") THEN "Google"
    WHEN CONTAINS_TEXT(Item Name, "YouTube") THEN "YouTube"
    ELSE "Other Brand"
END
Now, "Google Cloud" products will be correctly categorized because that specific condition is evaluated before the more general "Google" condition.
Leveraging Order for Simpler Expressions
Understanding this sequential evaluation also allows us to write more elegant CASE functions. For example, when categorizing customers by LTV:
CASE
    WHEN LTV >= 500 THEN "High Value Customer"
    WHEN LTV >= 250 THEN "Mid Value Customer"
    ELSE "Low Value Customer"
END
Notice that in the second condition, we don't need to specify WHEN LTV >= 250 AND LTV < 500. Since the function only reaches the second condition if the first one is false, we already know that LTV must be less than 500 at this point.
This sequential evaluation pattern lets us write cleaner, more maintainable code by eliminating redundant condition checks.
Cleaning Up Dimension Values with CASE
Many data sources deliver inconsistent dimension values that hinder analysis. For example, social media traffic might come through multiple variations of the same domain:
l.facebook.com
m.facebook.com
lm.facebook.com
In your reports, you want these all recognized simply as "Facebook." CASE makes this clean-up easy:
CASE
    WHEN CONTAINS_TEXT(Session Source, "facebook") THEN "Facebook"
    WHEN CONTAINS_TEXT(Session Source, "instagram") THEN "Instagram"
    WHEN CONTAINS_TEXT(Session Source, "pinterest") THEN "Pinterest"
    ELSE Session Source
END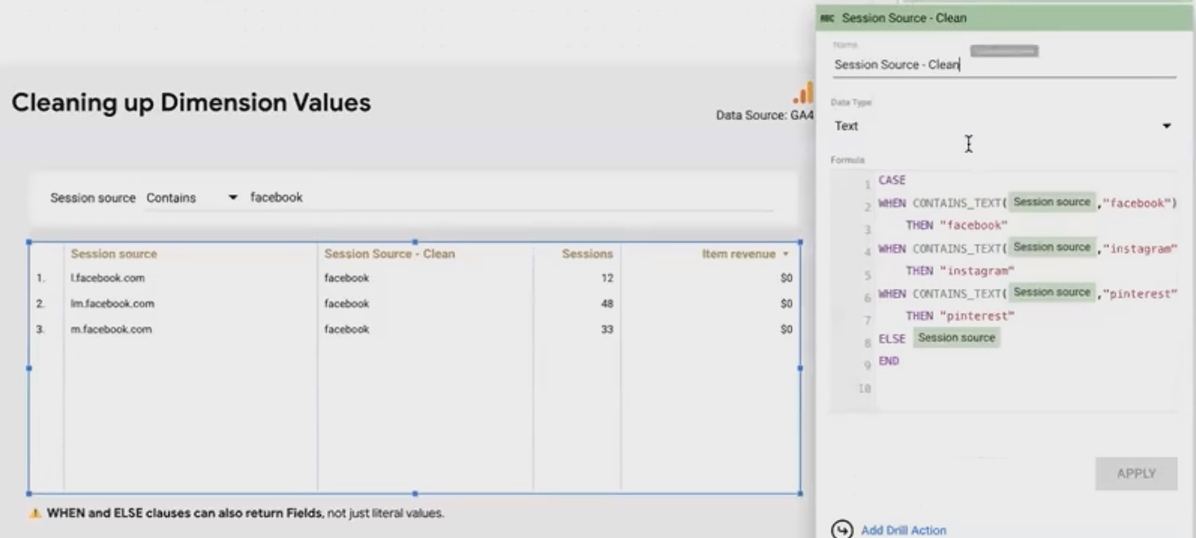
Notice the ELSE clause returns the original Session Source value for sources we're not explicitly cleaning up. This preserves important information while still consolidating the values we want to group.
Beyond Static Values: Returning Expressions or Fields
The CASE function's versatility extends beyond returning static text or numbers. The THEN clause can return the result of other functions, expressions, or fields.
For example, if product names include brand prefixes (like "Chrome Backpack" or "Google Cloud Bottle"), we might want to extract just the product part:
CASE
    WHEN CONTAINS_TEXT(Item Name, "Chrome ") THEN REGEXP_EXTRACT(Item Name, "Chrome (.*)")
    WHEN CONTAINS_TEXT(Item Name, "Google Cloud ") THEN REGEXP_EXTRACT(Item Name, "Google Cloud (.*)")
    ELSE Item Name
END
Here, we're using REGEXP_EXTRACT to return just the portion of the name that follows the brand identifier.
According to Optimize Smart's detailed guide on Looker Studio functions, this ability to nest functions within CASE statements makes it an extremely powerful tool for complex data transformations beyond simple categorization.
Dynamic Logic: Enhancing CASE with Parameters
One of Looker Studio's most powerful features is parameters, which allow report viewers to interact with and customize what they see. Parameters work beautifully with CASE to create dynamic reporting logic.
Imagine you want to check if salespeople are meeting a target revenue per lead, but that target might change over time:
Create a numeric parameter called "Target Revenue per Lead" with a reasonable default value (e.g., 75)
Create a calculated field using CASE:
CASE
    WHEN Revenue / Leads >= @Target Revenue per Lead THEN "Target Met"
    ELSE "Target Not Met"
END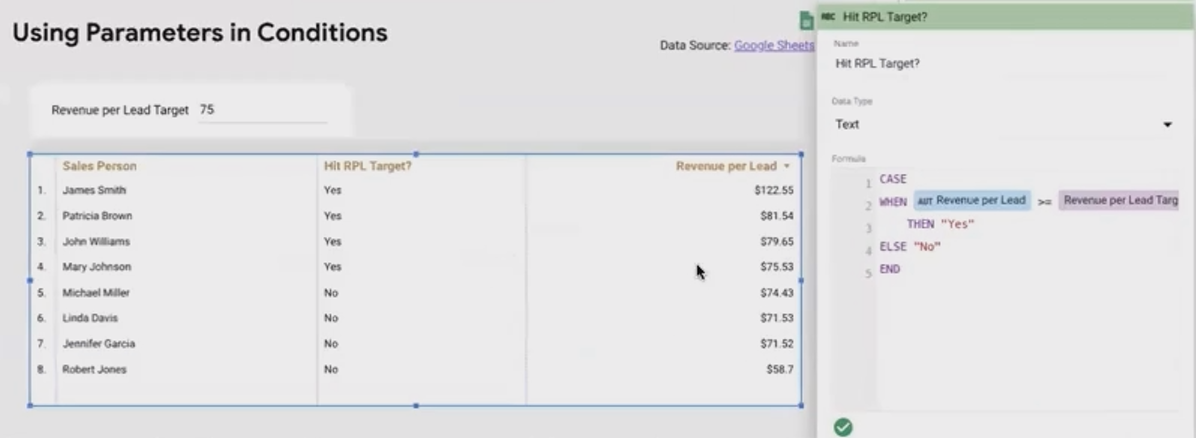
Now your report viewers can adjust the target threshold themselves, and your visualization will update in real-time to show who meets the new target.
Smart Counting: Aggregating CASE Results
Sometimes you need to count how many items fall into a specific category. By combining CASE with aggregation functions like SUM, you can easily accomplish this:
SUM(
    CASE
        WHEN CONTAINS_TEXT(Item Name, "Google Cloud") THEN 1
        ELSE 0
    END
)
This returns 1 for each item containing "Google Cloud" and 0 for all others, then sums these values to give you a total count of Google Cloud products.
According to a recent thread on the Google Cloud Community forum, this technique is particularly useful for counting specific events in GA4 data where you need to create custom metrics that don't exist natively.
Precision Targeting: Advanced Logical Conditions
For more sophisticated categorization, we can combine logical operators within our CASE conditions:
CASE
    WHEN CONTAINS_TEXT(Item Name, "Google")
         AND NOT CONTAINS_TEXT(Item Name, "Google Cloud")
         AND NOT CONTAINS_TEXT(Item Name, "Chrome")
    THEN 1
    ELSE 0
END
This counts items that contain "Google" but specifically exclude "Google Cloud" and "Chrome" – perfect for isolating the core Google brand from its sub-brands.
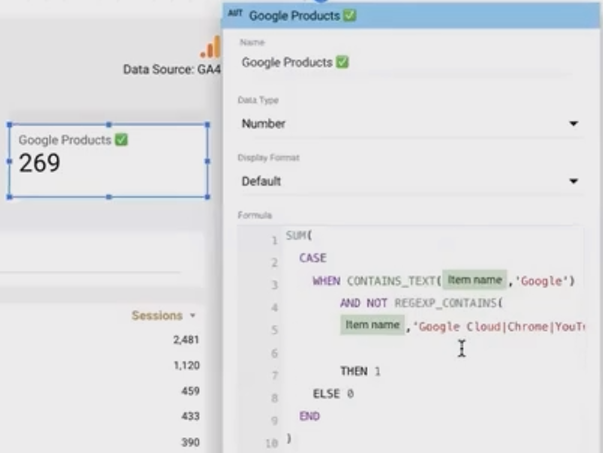
For even more concise expressions, you can use REGEXP_CONTAINS with pattern alternatives:
CASE
    WHEN CONTAINS_TEXT(Item Name, "Google")
         AND NOT REGEXP_CONTAINS(Item Name, "Google Cloud|Chrome|YouTube|Android")
    THEN 1
    ELSE 0
END
The pipe symbol (|) in the RegEx pattern represents "OR," allowing us to check for multiple excluded terms in a single expression.
The Ultimate Flexibility: Creating Dynamic Fields
Perhaps the most powerful application of CASE is creating fields that can change their entire behavior based on user selection. Let's look at how to create a dynamic metric that users can switch between:
Create a text parameter named "Selected Metric" with allowed values: "Sessions", "Users", "Engaged Sessions"
Link this parameter to a dropdown control on your report
Create a calculated field using CASE:
CASE
    WHEN Selected Metric = "Sessions" THEN Sessions
    WHEN Selected Metric = "Users" THEN Users
    WHEN Selected Metric = "Engaged Sessions" THEN Engaged Sessions
    ELSE NULL
END
This field will display the actual value of whichever metric the user selects from the dropdown. Combined with a clever table that displays the parameter value as its header, you can create the illusion of dynamically switching between metrics in a single visualization.
The same approach works for dimensions, allowing users to change how data is grouped or categorized on the fly.
According to Measure School's guide on Looker Studio CASE statements, this technique is particularly valuable for creating executive dashboards where different stakeholders may want to quickly switch between different perspectives on the same data.
Taking It Further: Nested CASE Functions
For hierarchical categorization, you can nest one CASE function inside another:
CASE
    WHEN STARTS_WITH(Page Path, "/shop") THEN
        CASE
            WHEN CONTAINS_TEXT(Page Path, "/collections/") THEN "Shop by Collection"
            WHEN CONTAINS_TEXT(Page Path, "/brand/") THEN "Shop by Brand"
            ELSE "Shop - Other Pages"
        END
    WHEN STARTS_WITH(Page Path, "/search") THEN "Search Page"
    ELSE "Other Website Pages"
END
This creates a two-level categorization – first determining if it's a shop page, then further categorizing the specific type of shop page.
Frequently Asked Questions (FAQs)
If a Boolean field is only true or false, can I create a single conditional formatting rule for both states?
While logically it makes sense to have a single rule with an "else" clause for Boolean fields, Looker Studio's conditional formatting interface currently requires separate rules. You'll need to create one rule for the "true" state (e.g., green) and another for the "false" state (e.g., red).
Can REGEXP_MATCH be used to isolate "Google" as a brand, specifically excluding "Google Cloud"?
REGEXP_MATCH can be tricky for this because it attempts to match the entire string pattern. For more precise control, it's often clearer to use CONTAINS_TEXT with logical operators:
WHEN CONTAINS_TEXT(Item Name, "Google")
     AND NOT CONTAINS_TEXT(Item Name, "Google Cloud")
THEN "Google Brand"
Alternatively, REGEXP_CONTAINS often works better than REGEXP_MATCH for partial string matching within a larger text field.
How do I debug my CASE function when it's not returning what I expect?
The most effective debugging approach is to add your CASE function to a table alongside the original fields it's evaluating. This allows you to see exactly which conditions are being met for each row. Pay special attention to the order of your WHEN clauses, as this is the most common source of unexpected results.
The CASE function is truly one of Looker Studio's most versatile and powerful tools for data transformation. From simple categorization to dynamic, parameter-driven fields, it enables a level of customization and insight that elevates your reports from basic data displays to interactive analytical tools.
By mastering CASE, you unlock the ability to:
Create meaningful categories from raw data
Clean up inconsistent dimension values
Build dynamic, user-controlled visualizations
Perform complex counting and aggregation
Establish hierarchical categorization systems
As you continue your Looker Studio journey, experiment with combining CASE with other functions, parameters, and visualization techniques. The possibilities are virtually limitless, limited only by your analytical imagination and the questions you need your data to answer.
What complex categorization challenges are you facing in your Looker Studio reports? Try applying some of these CASE function techniques and see how they transform your data into clearer, more actionable insights.
Note:
This post is based on a subject covered in the Looker Studio Masterclass Program. To learn more about Looker Studio Masterclass, click here.