
Looker Studio Button Tutorial: Create One-Click Filters, Dynamic Links & Custom Navigation
Have you ever wanted to make your Looker Studio reports more intuitive and user-friendly? In this guide, we'll explore one of the most powerful interactive elements available: Buttons. These seemingly simple components can revolutionize how your users navigate, filter, and interact with your dashboards.
As we've covered in previous lessons, interactive elements are what separate Looker Studio from static reports. While charts display data, controls empower viewers to manipulate and explore that data. Buttons represent the next evolution in this interactive journey.
Let's dive into the four key ways you can leverage buttons to elevate your reporting experience.
Navigation Made Beautiful: Using Buttons as Links
The most straightforward application of buttons is as navigation links. While this might seem basic, buttons offer distinct advantages over standard text or image links.
Why Choose a Button Over a Text Link?
Buttons are immediately recognizable as clickable elements. They provide a clear visual cue that says "click me" - something that can be less obvious with plain text links. They also maintain a consistent style and can be more accessible for users.
To create a navigation button:
Add a button from the Add a control menu
In the Setup tab, select Navigation as the action type
Enter your destination URL or choose a dynamic page link (First Page, Previous Page, etc.)
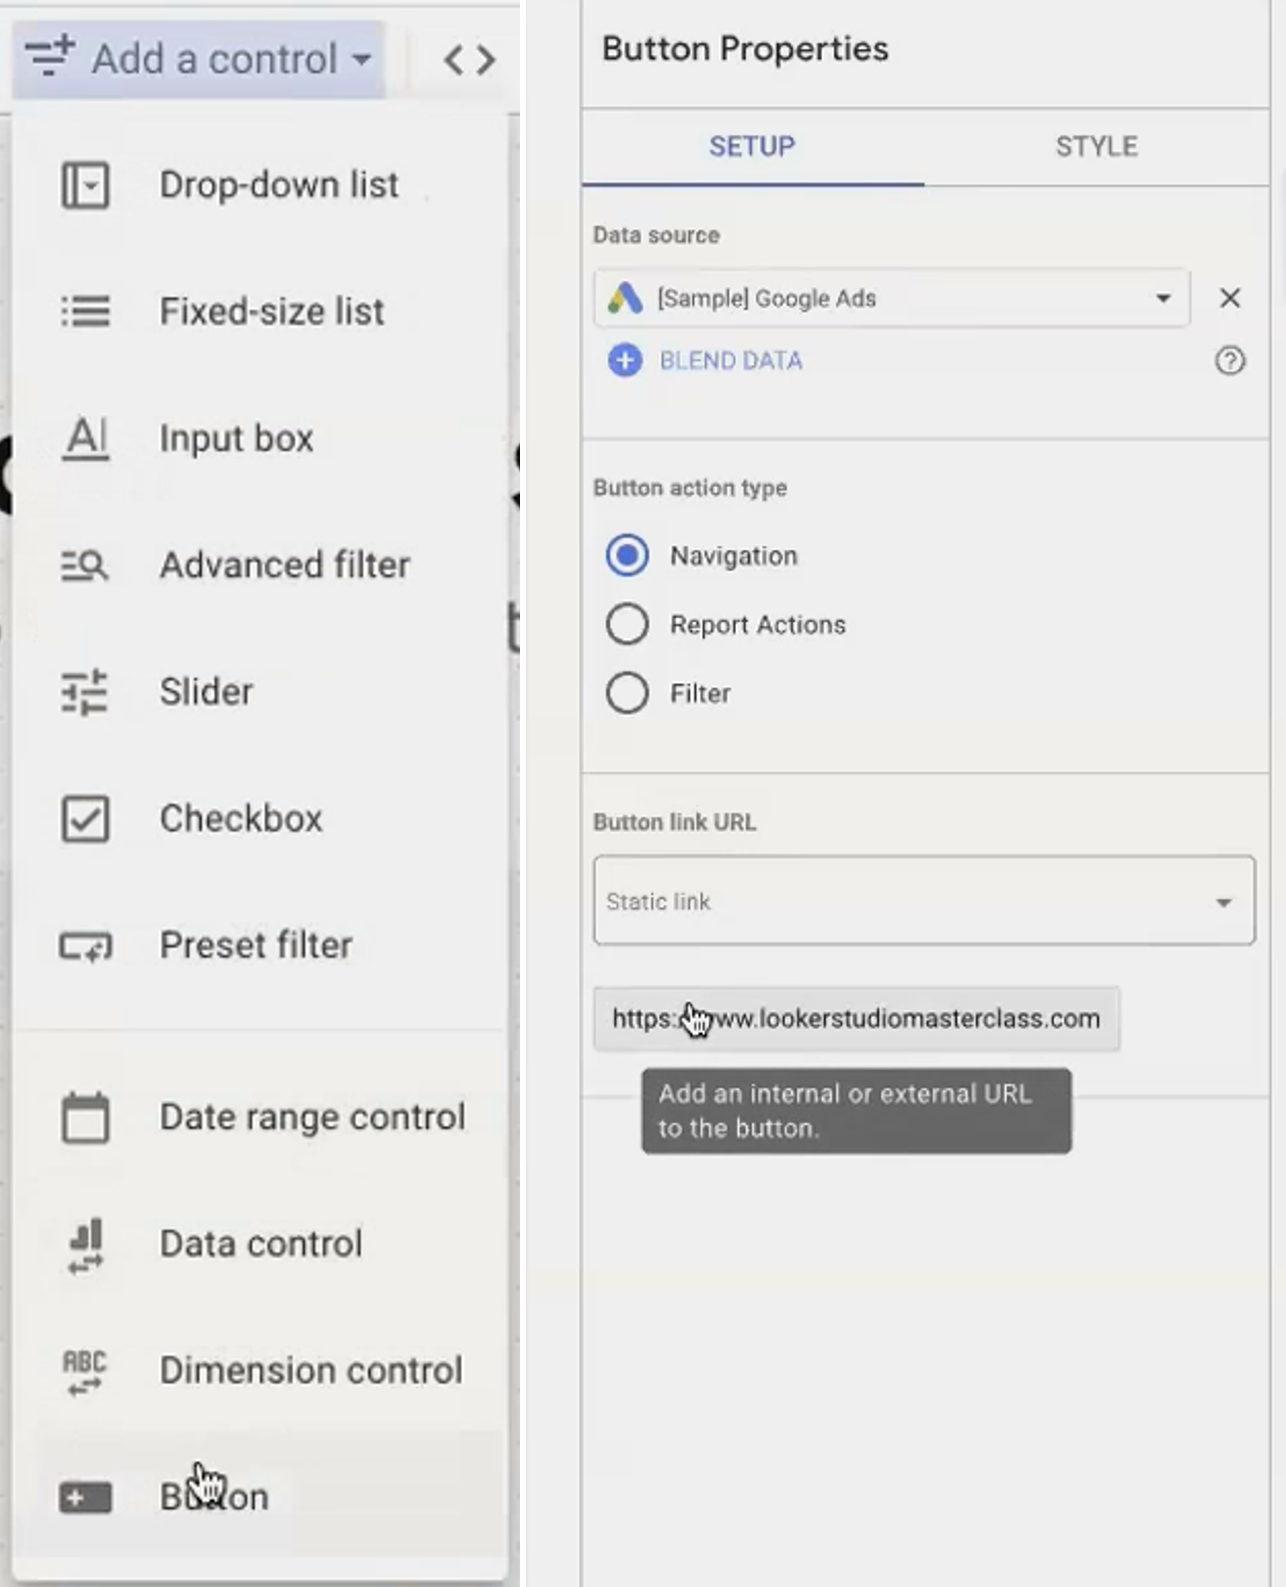
For external links, don't forget to check the Open in new tab option to keep your users within your report ecosystem.
The Secret Weapon: Dynamic Links from Dimensions
Here's where buttons truly outshine regular links: Dynamic Links from Dimensions. This unique feature allows buttons to generate URLs based on values in your dataset.
For example, imagine you have a table of landing pages from your Google Analytics data. You can create a button that dynamically links to whichever page the user has selected in the table.
To set this up:
Ensure your dataset contains a field with valid URLs (or create one using CONCAT)
Assign this field to the button as a "Dynamic link from dimension"
Enable cross-filtering on your table of URLs
Now when a user clicks on a specific row in your table, the button will update to link directly to that URL. This is incredibly powerful for creating contextual actions that respond to user selections.

Configure a button to dynamically link to URLs from your dataset, creating contextual navigation options.
Streamline Common Tasks with Report Action Buttons
The second approach transforms buttons into shortcuts for common Looker Studio operations, making your reports more accessible to less technical users.
Four Essential Report Actions
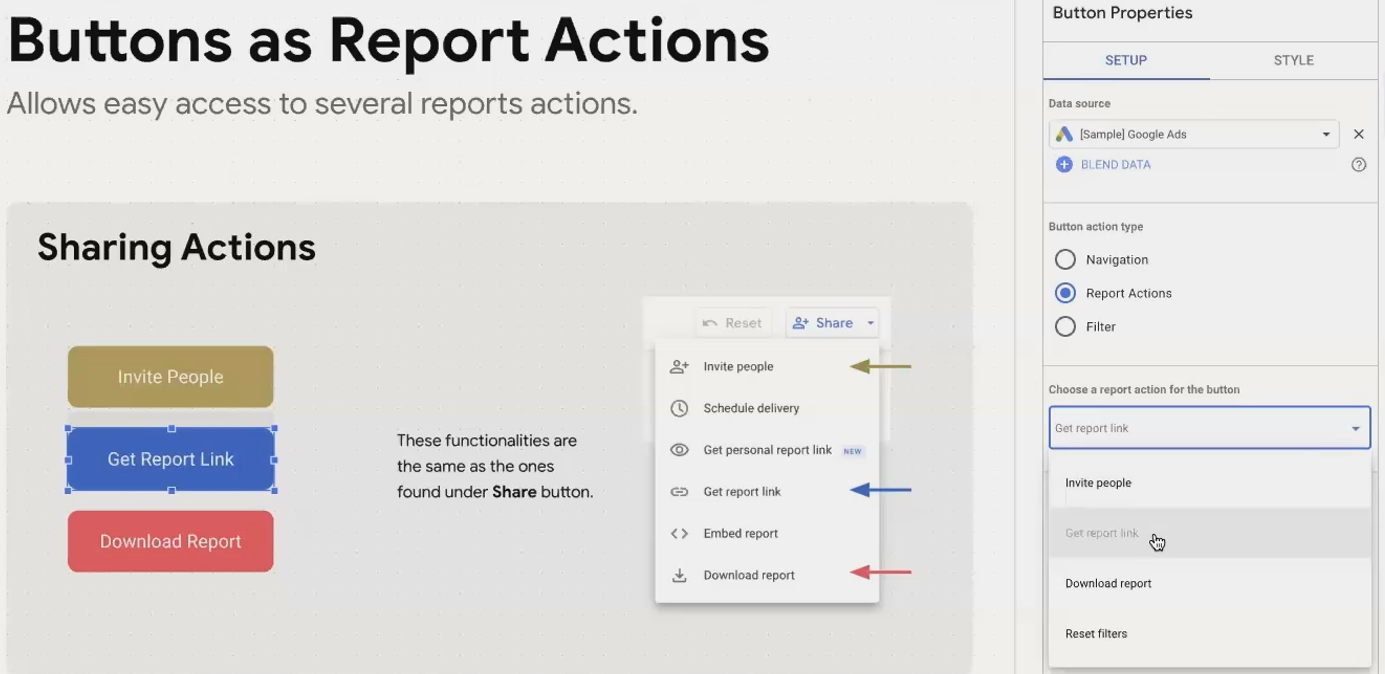
When you set a button's action type to Report Action, you can choose from these options:
Invite People: Opens the sharing dialog to easily add new users
Get Report Link: Generates a shareable link to the report
Download Report: Launches the PDF download dialog
Reset Filters: Clears applied filters to return to the default view
That last option “Reset Filters” deserves special attention.
The Strategic Reset: More Control Than You Think
Unlike the global reset button in the report header (which resets everything), a custom reset button can be selective. By grouping the button with specific controls using the Arrange > Group function, you can make it reset only those specific filters.
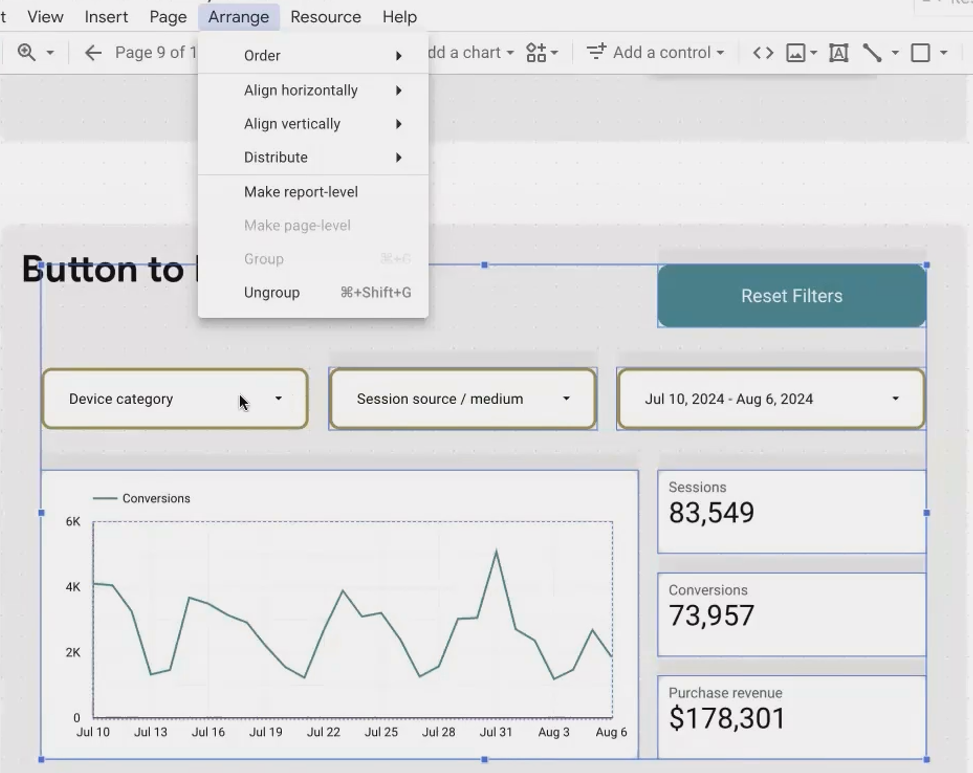
This is perfect for complex reports where you might want separate reset buttons for different sections or analysis areas.
Pro Tip: Create multiple reset buttons on different parts of your report to give users granular control over their filtering experience.The Game Changer: Buttons as Preset Filters
Now we're getting to the truly transformative use of buttons. What if you could create one-click filters for common segments your users want to analyze?
Preset filter buttons allow you to define specific filtering criteria and apply them with a single click. Think of buttons labeled "Mobile Traffic Only," "US Customers," or "High-Value Transactions."
How It Works: Boolean Logic in Action
The secret to preset filter buttons is Boolean logic. You need to:
Create a calculated field that returns either TRUE or FALSE
Assign this field to a button as its "Control field"
For example, to create a "US Traffic" button:
Create a calculated field:
Country = "United States"Add a button and set its action type to Filter
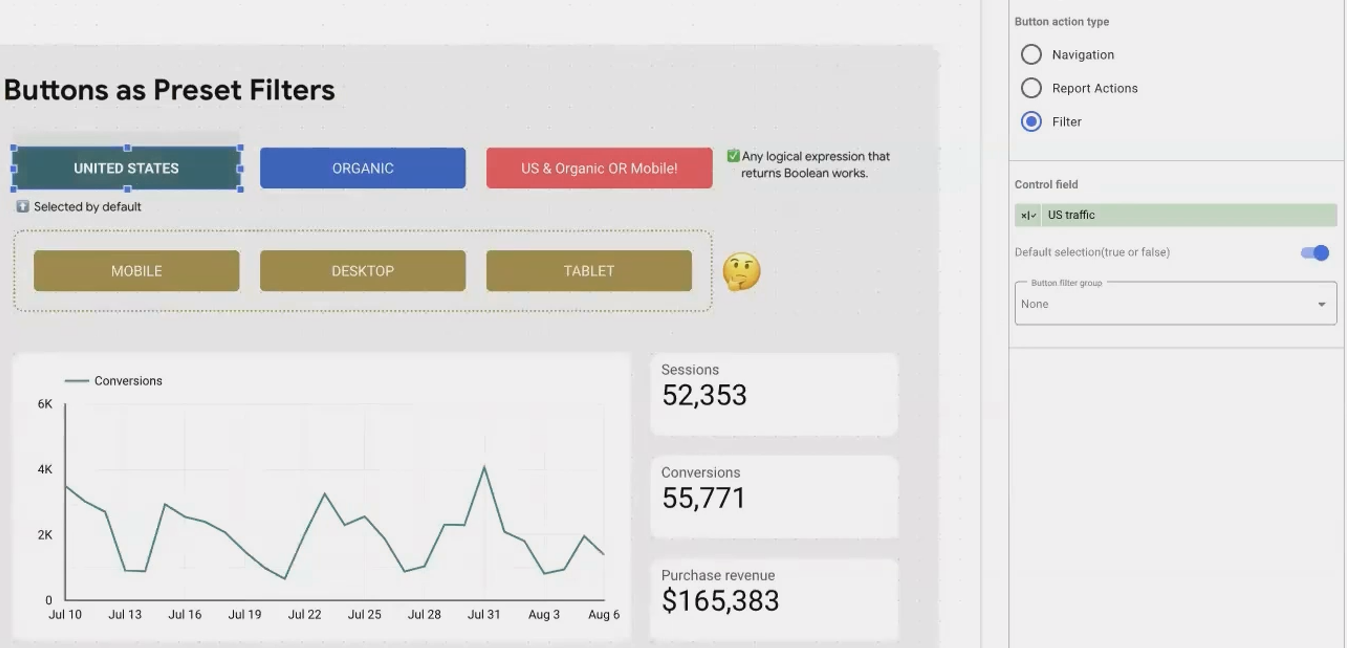
Select your new field as the Control field
Set "Default selection" to determine if the filter is applied when the report loads
When a user clicks this button, Looker Studio filters the entire report to show only data where that condition is true.
Building More Complex Filter Logic
Your Boolean formulas can be as simple or complex as needed. You can combine conditions using AND, OR, and parentheses:
(Country = "United States" AND Source = "organic") OR Device = "mobile"A button using this formula would show data that is either from US organic traffic OR from any mobile device regardless of location.

Create sophisticated filtering logic that users can apply with a single click.
Watch Out for Case Sensitivity!
One critical gotcha: these expressions are case-sensitive. If your data contains "organic" (lowercase) but your formula checks for "Organic" (capitalized), it will never match. Always verify the exact format of values in your dataset.
Creating Intuitive Choices with Button Groups
What happens when you have multiple filtering buttons that should be mutually exclusive? For example, device type buttons for "Desktop," "Mobile," and "Tablet" - a user should only be able to select one at a time.
Button groups solve this elegantly. By assigning buttons to the same group number (1-5), you ensure that only one button in that group can be active at any time. Clicking one button automatically deactivates any other button in the same group.
Setting Up Button Groups
Create your preset filter buttons as described above
In each button's style properties, assign them all to the same Button group (e.g., "1")
When the report loads, at most one button in each group can have its "Default selection" set to true
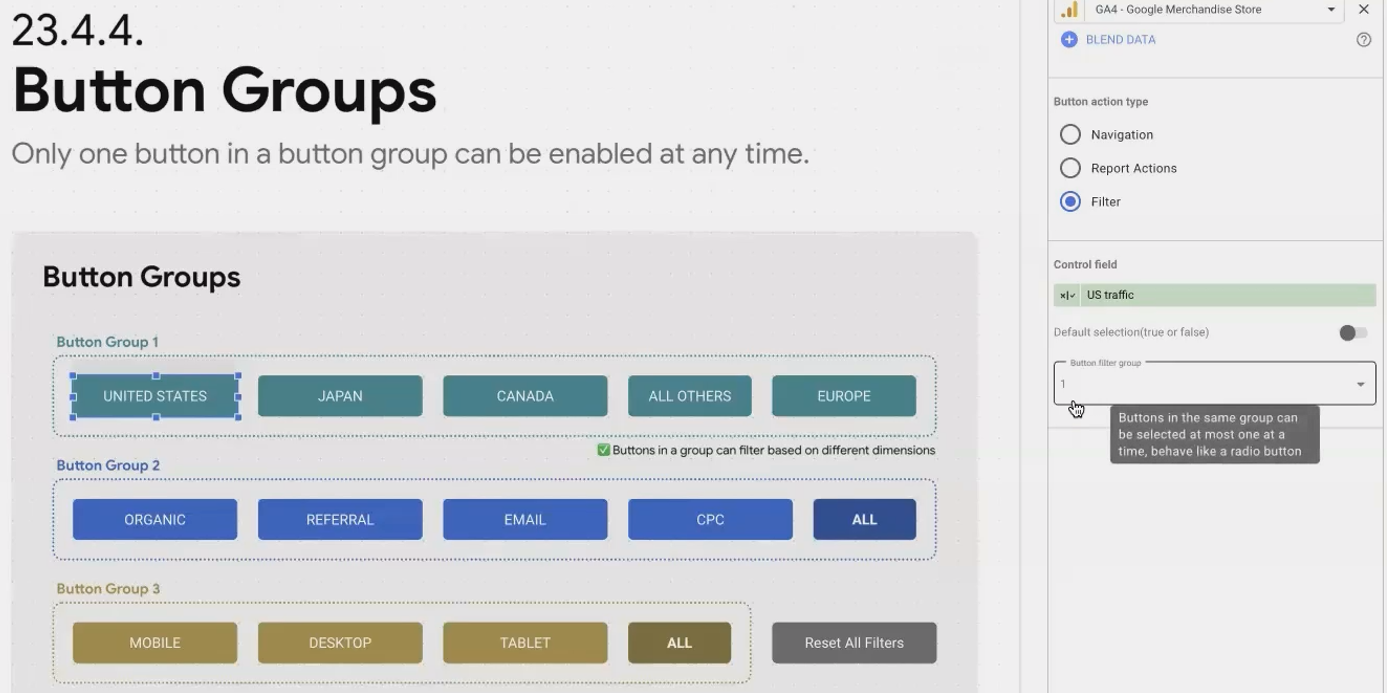
This creates a radio-button-like experience where options are mutually exclusive.
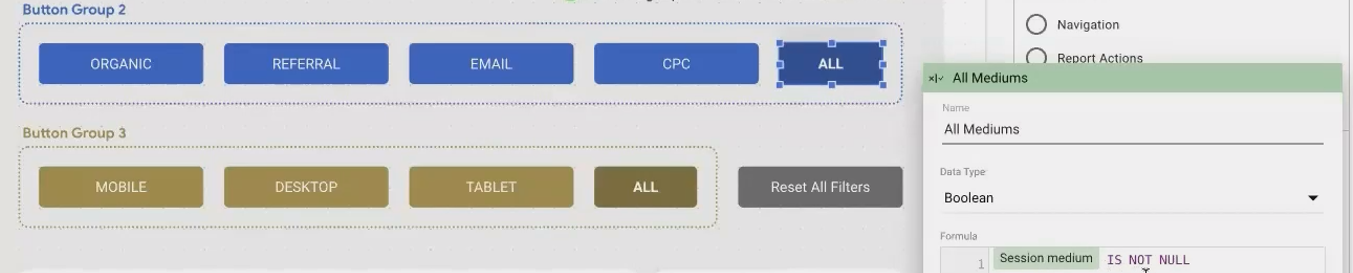
Creating an "All" Option
For completeness, you'll often want an "All" option that deactivates filtering. There are two elegant approaches:
Create a button with a formula that's always true:
Country IS NOT NULLInclude it in the same button group as your other filters
Alternatively, you can add a "Reset Filters" button specifically for that group.
Practical Applications for Button Interactivity
Now that you understand the mechanics, let's explore some real-world applications:
Segment Analysis: Create buttons for key customer segments (New vs. Returning, High-Value vs. Low-Value)
Campaign Focus: Add buttons to filter for specific marketing campaigns or channels
Geographic Filtering: Create button groups for regions or markets your stakeholders frequently analyze
Time Period Comparisons: Beyond the date range control, create preset buttons for YoY, QoQ, or MTD vs. Full Previous Month comparisons
KPI-Specific Views: Configure buttons that not only filter data but link to dedicated pages focused on specific metrics
Frequently Asked Questions (FAQs)
Can I change how a button looks when it's selected?
Currently, Looker Studio offers limited styling for the selected state of buttons. When selected, the button's text becomes slightly bolder and the background becomes a bit darker. Unfortunately, there's no way to fully customize these states yet.
How many button groups can I have in one report?
Looker Studio allows up to 5 distinct button groups in a single report. These are numbered 1-5 in the style properties panel.
Can I use buttons to filter across multiple pages?
By default, filter buttons only affect the page they're on. However, if you create report-level buttons (by placing them in the header and making them report-level components), they can filter across all pages.
How do I know if my Boolean formula for a button filter is correct?
Create a temporary table chart with your Boolean field added as a dimension. This will show you exactly which rows return TRUE vs. FALSE, helping you verify your logic before assigning it to a button.
Can I combine a button filter with other filters?
Absolutely! Button filters work alongside all other filter types. This allows users to first apply a preset filter via button, then further refine results using dropdown filters or cross-filtering.
By strategically implementing buttons throughout your Looker Studio reports, you can dramatically improve the user experience. You'll not only make your reports more intuitive and accessible but also enable your viewers to find insights faster without needing to understand the underlying data structure.
Remember that the best interactive elements are those that solve real problems for your users. Start by identifying the common questions or segments your stakeholders care about, then design your button system to address those specific needs.
What creative button applications will you implement in your next Looker Studio report?
Note:
This post is based on a subject covered in the Looker Studio Masterclass Program. To learn more about Looker Studio Masterclass, click here.