
How to Create Interactive BigQuery Dashboards with Looker Studio Parameters
Have you ever wished you could make your Looker Studio reports more dynamic and interactive? If you're connecting to BigQuery data sources, there's a powerful feature that might just change the way you build reports forever: parameters in BigQuery connections.
In this guide, I'll walk you through how to leverage this powerful combination to create highly interactive, user-driven analytics dashboards that can transform raw data into actionable insights on the fly.
What Makes BigQuery Parameters Special?
Before we dive in, let's understand what sets BigQuery parameters apart from regular Looker Studio parameters.
When you create a standard parameter in Looker Studio, it typically works as a variable you can reference in calculated fields or filters. But BigQuery parameters are different. They allow you to dynamically modify the actual SQL query that pulls your data.
Think of it as giving your report viewers the power to customize their data pull at the database level, without them needing to know a single line of SQL.
The Standard vs. Custom Query Approach
There are two ways to connect Looker Studio to BigQuery:
Standard Method: Select a project → select a dataset → select a table.
This is equivalent to running
SELECT * FROM tableSimple but inflexible
Custom Query Method: Select a project → write your own SQL query.
Complete control over what data gets pulled
Ability to add parameters directly into your query
Opens the door to complex data transformations
The custom query approach is where the magic happens for creating truly interactive reports.
Creating Your First BigQuery Parameter
Let's walk through a practical example. Imagine you're analyzing population data across the United States, and you want to let users explore populations within specific geographic areas.
Here's how to set it up:
In Looker Studio, click Create Data Source
Select BigQuery as your connector
Instead of selecting "My Projects," click Custom Query
Select the project that contains your data (this is for billing purposes)
Now, the exciting part, click Add Parameter

When adding parameters, you'll notice the interface looks familiar, but these parameters work differently behind the scenes.
You can add multiple parameters. For our geographic analysis, we'll add:
lat(latitude)long(longitude)distance(radius in miles)
Once created, these parameters can be referenced in your SQL query using the @parameter_name syntax:
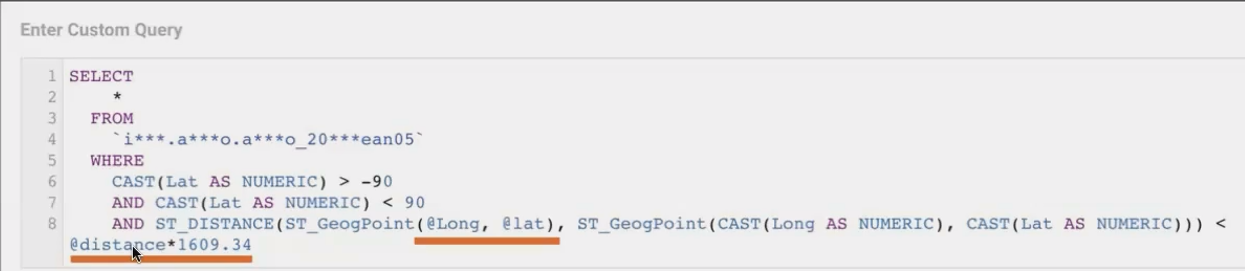
This query finds all locations within a specific distance (converted from miles to meters) of the point defined by the latitude and longitude parameters.
Building an Interactive Location Analysis Dashboard
Now that we have our parameterized query set up, let's create a dashboard that allows users to analyze population data for any location in the US.
Step 1: Add Input Controls for Your Parameters
For each parameter we created, we'll add an input box control to the canvas:
Add an Input Control from the Insert menu
Set it to control your
latparameterRepeat for
lonanddistance
Arrange these inputs prominently on your dashboard so users know they can interact with them.
Step 2: Create Visualizations for the Results
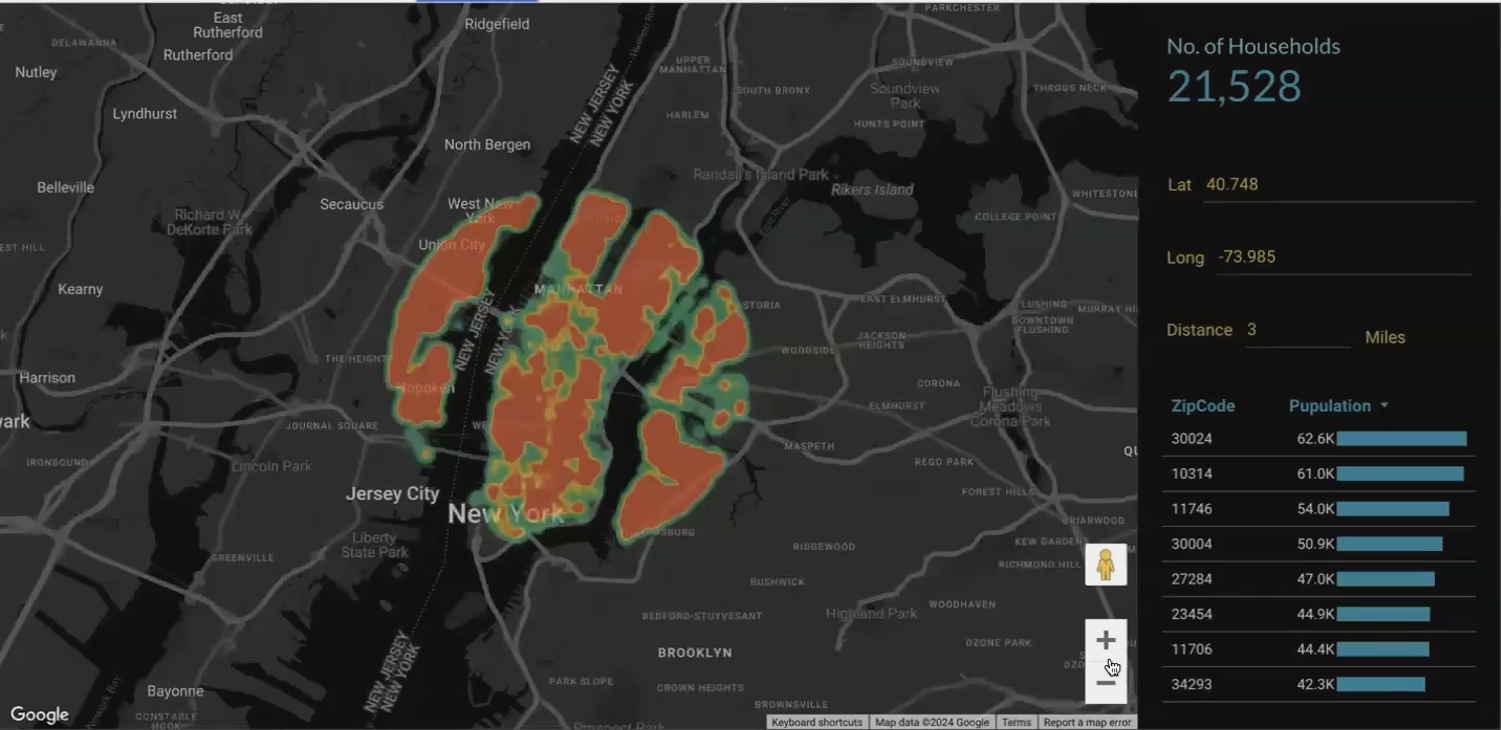
With our dynamic query in place, we can now create visualizations that automatically update when parameter values change:
A map chart showing the location and surrounding area
A table with detailed population data
A summary card showing total population within the selected radius
Step 3: Enhance with Meaningful Context
To make your dashboard truly useful, add:
A clear title explaining what the dashboard does
Instructions for how to use the parameters
Default values that show an interesting initial view (like a major city)
Advanced Technique: Setting Parameter Values Through URLs
One powerful feature of parameters is the ability to pass values directly through the report URL. This means you can create bookmarks or links to specific views of your data.
Unlike regular filters, parameters in URLs require a bit more setup:
Go to Resource > Manage report URL parameters
Check the box next to each parameter you want to enable in the URL
Now you can append parameter values to your report URL
The format is a bit complex, following JSON notation:
https://lookerstudio.google.com/reporting/report-id?params=%7B%22lat%22%3A40.7128%2C%22lon%22%3A-74.006%2C%22distance%22%3A5%7DTo simplify this process, I've created a Google Sheet template that generates these URLs automatically. Just enter your base report URL and parameter values, and it produces a ready-to-use link.
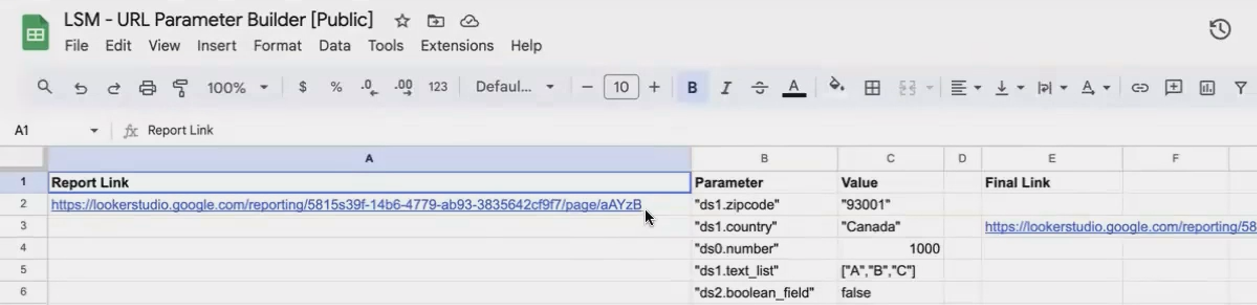
This template makes it easy to create parameter-based URLs
Real-World Application: Coffee Shop Location Planning
Let me share how one of my clients used this exact technique to transform their business planning process.
A growing coffee chain wanted to identify optimal locations for new branches. They knew their target audience overlapped with Starbucks Reserve customers, so they created a dashboard using BigQuery parameters to analyze populations around existing Starbucks locations.
Their workflow was simple but powerful:
Find a Starbucks Reserve location on Google Maps
Copy the latitude/longitude coordinates
Enter these into their Looker Studio dashboard
Set a radius of 3 miles
Instantly see population demographics within that radius
This allowed them to compare dozens of potential locations in a single meeting, identifying areas with the perfect combination of population density and target demographics.
By creating a table of "favorite locations" with pre-built parameter URLs, they could quickly jump between different scenarios without manually re-entering coordinates.
Why This Approach Beats Alternatives
You might be wondering: "Couldn't I just create a view in BigQuery with this logic and connect to that?"
While that's possible, using parameters in a custom query offers several advantages:
Real-time adjustments: Users can modify the analysis parameters without needing access to BigQuery
Experimentation: Testing different scenarios becomes a matter of changing input values, not rewriting SQL
Encapsulation: The query logic stays within your Looker Studio report, not in the client's BigQuery project
Portability: The same report can be connected to different datasets with minimal changes
The flexibility this approach offers is unmatched by static views or standard connections.
Frequently Asked Questions (FAQs)
How do BigQuery parameter costs work?
Each time a user changes a parameter value, it can trigger a new query against BigQuery, which incurs costs based on the amount of data processed. To manage costs:
Ensure the BigQuery project is connected to the appropriate billing account
Consider adding data freshness settings to limit how often queries run
Use smaller, summarized tables when possible
Monitor usage patterns to identify optimization opportunities
Can I combine BigQuery parameters with regular Looker Studio parameters?
Absolutely! For example, you might use BigQuery parameters for geographic filtering in your query, while using standard Looker Studio parameters for visualization options like chart type preferences or display settings.
How can I prevent excessive querying when users are adjusting multiple parameters?
A good practice is to add a "Submit" or "Run Analysis" button using a Boolean parameter. Set up your query to only run when this parameter is true, allowing users to set all their criteria before triggering the potentially costly query.
What's the difference between using parameters and setting filter values through the URL?
Filter values can be passed through the URL with a simple setting (Edit → Report settings → Enable filter values in report link), but they only filter data after it's been queried. Parameters in the URL can change the query itself, potentially reducing the amount of data processed and offering more flexibility.
Parameters in BigQuery connections represent one of the most powerful features in Looker Studio, allowing you to create truly dynamic, user-driven analytics experiences. By mastering this technique, you'll be able to:
Build flexible dashboards that adapt to user needs
Reduce the amount of data processed for better performance
Create scenario-planning tools that provide immediate insights
Deliver more value to your clients or organization
In the next part of this series, we'll explore how to apply these same principles to service planning and market expansion analysis. Until then, I encourage you to experiment with this powerful feature in your own reports!
Note:
This post is based on a subject covered in the Looker Studio Masterclass Program. To learn more about Looker Studio Masterclass, click here.