
Looker Studio Audit Logs: A Complete Guide to Tracking & Managing Report Activity
As your collection of Looker Studio reports grows, so does the challenge of keeping everything organized and under control. Whether you're creating reports for clients, team members, or your organization, you need robust systems to track who's accessing what, manage report versions, and ensure everything runs smoothly.
In this deep dive, we'll explore one of the most powerful yet underutilized features in Looker Studio: Log Event Auditing. This capability provides unprecedented visibility into how your reports are being used, who's making changes, and when critical actions occur.
Understanding Looker Studio Log Events
What Are Log Events and Why Should You Care?
Looker Studio, as part of the Google Workspace ecosystem, maintains detailed logs of user interactions with your reports and data sources. These logs capture who did what and when, information that remains invisible through standard analytics tracking.
Think of log events as your report's security camera footage. While Google Analytics 4 might tell you that someone viewed a page, log events tell you exactly who that person was, what actions they took, and when they took them.
This level of visibility is crucial for:
Security audits: Identifying unauthorized access or changes
Resource allocation: Confirming departments are actually using reports they requested
Collaboration tracking: Seeing which team members are actively working on reports
Change management: Understanding when and how reports were modified
Who Can Access These Logs?
Log events are available to Google Workspace administrators or users with the specific "Looker Studio Administrator" role. This is a workspace-level permission, not tied to Looker Studio Pro subscription status.
If you're using a personal Gmail account with Looker Studio, unfortunately, you won't have access to these detailed logs. This feature requires a Google Workspace organization.
Accessing and Navigating Looker Studio Logs
Step-by-Step: Finding Your Log Events
Log in to admin.google.com with administrator credentials
Navigate to Reporting > Audit and Investigation
Scroll down and select Looker Studio log events
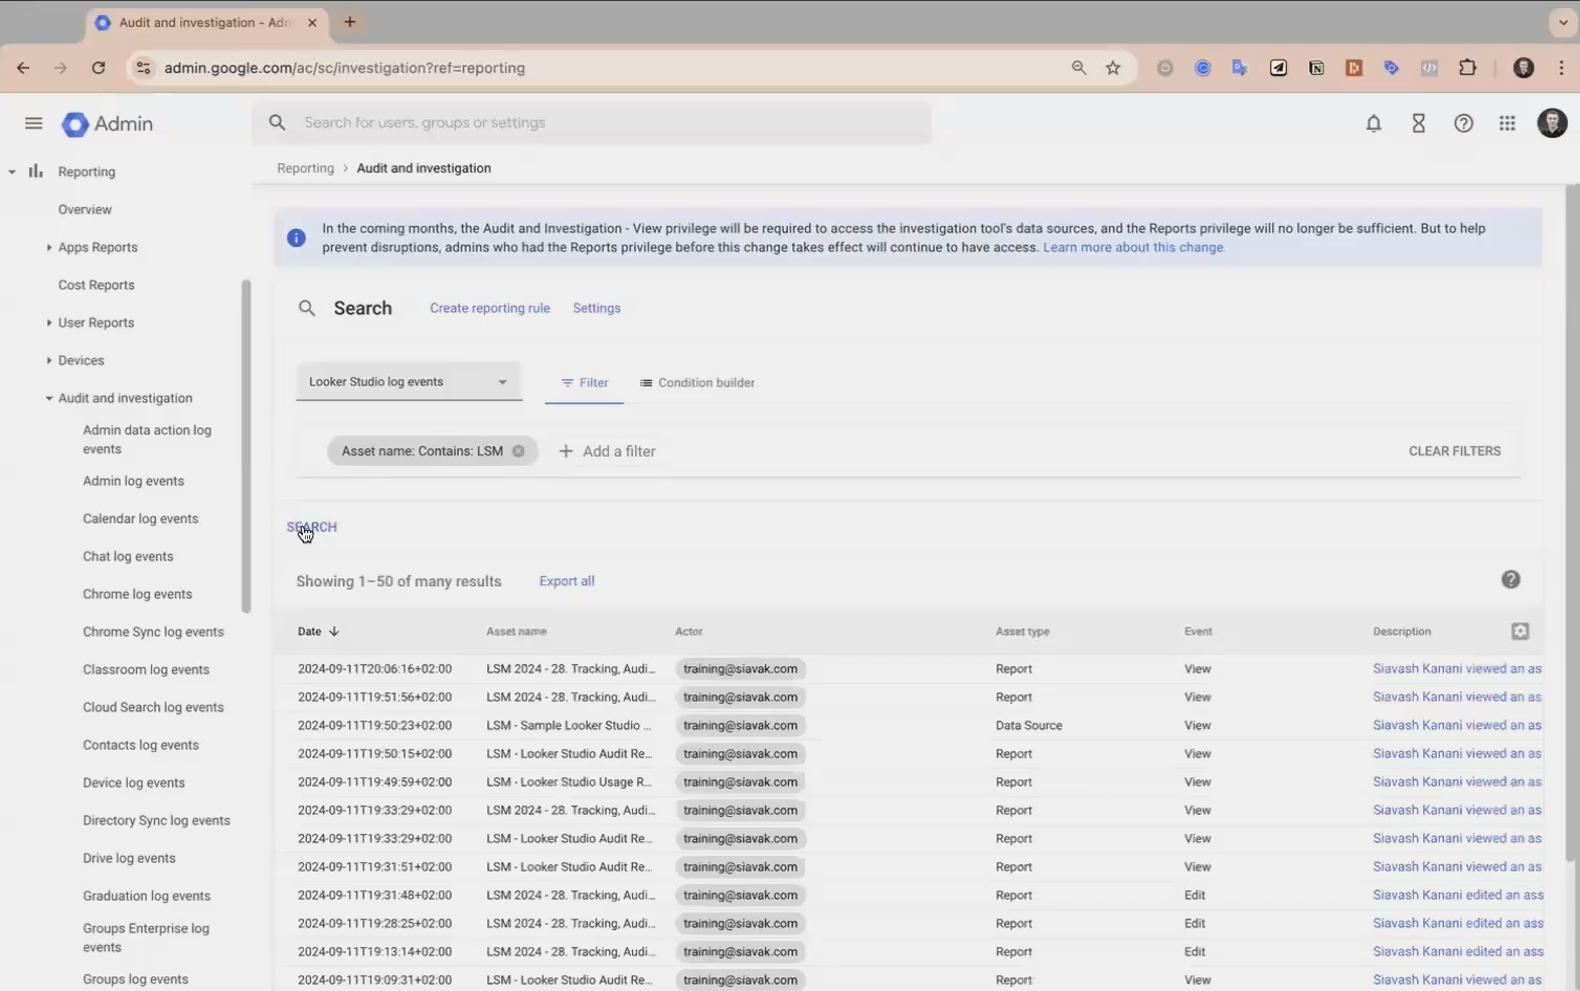
Navigation path to Looker Studio log events in the Google Workspace Admin Console
Understanding the Log Interface
Once you've accessed the logs, you'll see a table with these key columns:
Date: When the action occurred
Asset Name: The name of the report or data source
Actor: Who performed the action (email address)
Asset Type: Whether it's a report or data source
Event: The specific action taken (view, edit, share, etc.)
You can filter this list to focus on specific reports, users, or actions. For example, typing your client's name or report code in the filter will show only events related to those assets.
Digging Deeper: Detailed Event Information
Clicking on any event's description reveals additional details:
Full event description
IP address of the user
Visibility settings before and after changes
Any permission changes made
This granular information is invaluable for troubleshooting and security investigations.
Turning Raw Data into Actionable Insights
Exporting Log Data for Analysis
The log interface provides a basic view, but for deeper analysis, you'll want to export the data:
Apply relevant filters to focus on specific reports or time periods
Click Export All (this exports up to six months of log data)
Choose Google Sheets as your export destination
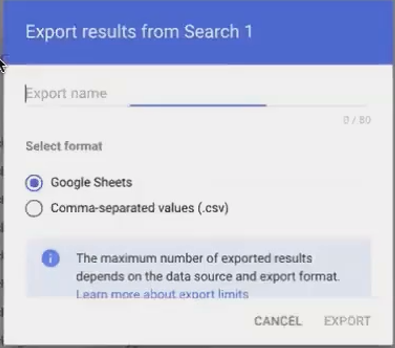
This creates a spreadsheet with complete log data that you can then analyze or visualize.
Creating a Meta-Dashboard in Looker Studio
Here's where things get meta and powerful. By connecting your exported log data to Looker Studio itself, you can create a dashboard that visualizes activity across all your reports:
Connect your exported Google Sheet to a new Looker Studio report
Create visualizations for metrics like:
Top reports by usage
Most active users
Actions over time
Device types used to access reports
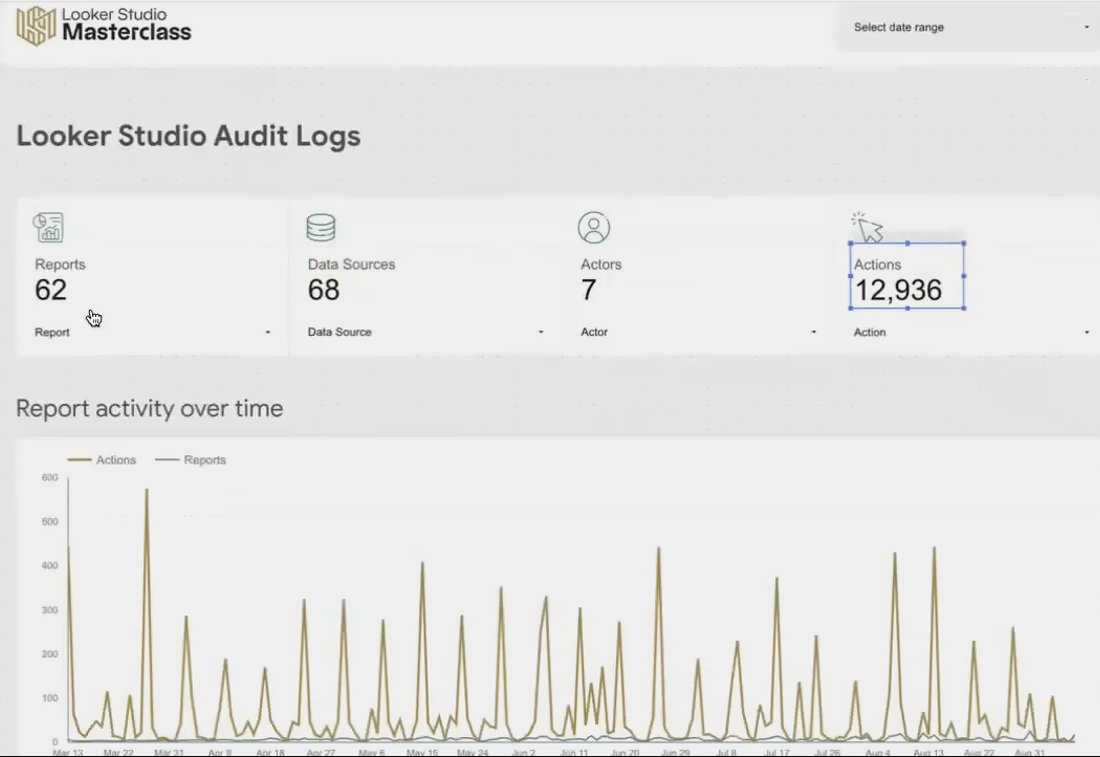
Example of a meta-dashboard showing report usage metrics from log data
This approach transforms raw log data into a strategic asset management tool that helps you understand usage patterns and make informed decisions about report development.
Setting Up Proactive Monitoring with Alerts
Creating Custom Alert Rules
Rather than manually checking logs, you can set up alerts for critical events:
In the log events interface, click Create Reporting Rule
Name your rule (e.g., "Critical Report Deletion Alert")
Set criteria (e.g., Asset Name contains "Executive Dashboard" AND Event is "Delete")
Add an action, typically sending an email to designated administrators
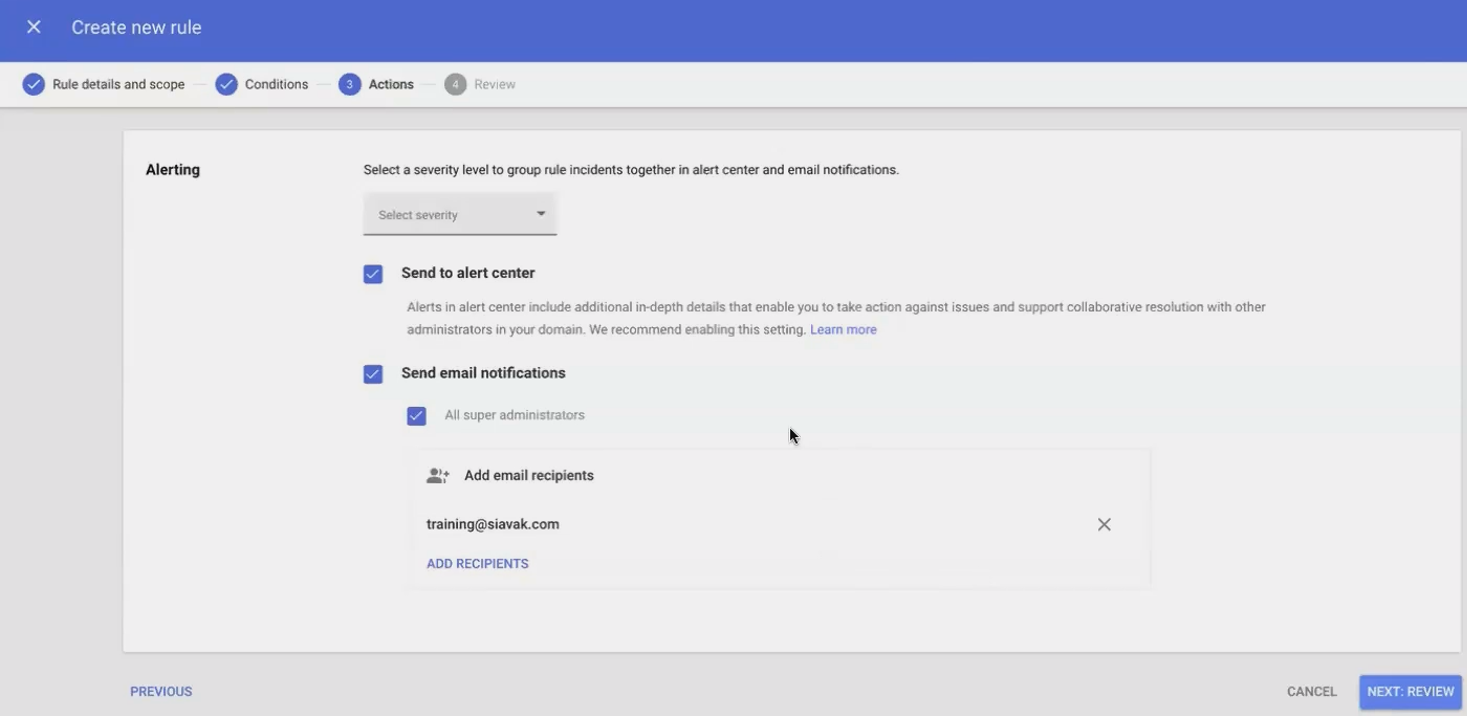
Strategic Alert Use Cases
Consider setting up alerts for these high-value scenarios:
When sharing permissions change on confidential reports
When critical data sources are modified
When specific users perform unusual actions
When reports are accessed from unexpected locations

Sample email of Reporting Rule
These alerts have saved our team countless headaches by notifying us immediately when someone accidentally deletes a report component or changes a crucial data connection.
Practical Applications: Real-World Examples
Case Study: Client Report Usage Audit
One of our enterprise clients invested in creating numerous department-specific dashboards. Six months later, the CFO wanted to know if this investment was paying off.
By exporting the log data and creating a visualization, we demonstrated:
Which departments were actively using their reports
Which reports had fallen into disuse
The specific executives who had never logged in
This data-driven approach allowed them to focus their reporting resources where they'd have the most impact and retire unused dashboards.
Internal Team Oversight
For agencies and consultancies, log auditing provides valuable insights into team workflows:
Who's putting in the most time on client reports
Which reports require the most maintenance
When team members are making unexpected changes
Frequently Asked Questions (FAQs)
Are the log events available for all Google Workspace organizations or only for Looker Studio Pro accounts?
They're available for all Google Workspace organizations, regardless of whether you have Looker Studio Pro. Access depends on your Google Workspace plan and administrator permissions, not your Looker Studio tier.
How long are log events stored?
Google Workspace retains Looker Studio log events for 6 months. If you need longer-term retention, you should export the data regularly and append it to your historical records.
Can I see what changes were made to a report in the logs?
The logs show that a change occurred and who made it, but not the specific content of the change. For that level of detail, you'd need to use the Version History feature of Looker Studio.
Is it possible to track when scheduled emails of reports are opened?
Unfortunately, no. The log events can't track when automatically scheduled report emails are opened. For that kind of tracking, you would need to implement a separate email tracking solution.
Best Practices for Log Event Auditing
To get the most from Looker Studio log events:
Schedule regular exports: Don't lose valuable historical data due to the 6-month retention limit.
Create a standardized dashboard: Build a template that you can quickly update with fresh export data.
Combine with naming conventions: Consistent report naming makes filtering and analysis much more powerful.
Set up critical alerts: Don't rely solely on periodic reviews, get notified when important events occur.
Share insights with stakeholders: Provide usage statistics to report owners so they can see if their reports are being utilized.
Audit logging transforms Looker Studio from a report creation tool into a managed analytics environment. By understanding who's using your reports, how they're being modified, and when critical events occur, you gain the control needed to scale your reporting ecosystem effectively.
While this level of audit capability might seem like overkill for small projects, it becomes invaluable as your report library grows. The organizations that get the most value from Looker Studio are those that treat it as a strategic platform and strategic platforms require strategic oversight.
In the next sections of this guide, we'll explore manual report publishing, usage tracking with GA4, version history management, and naming conventions to complete your Looker Studio asset management toolkit.
Note:
This post is based on a subject covered in the Looker Studio Masterclass Program. To learn more about Looker Studio Masterclass, click here.