
Mastering Looker Studio Parameters: Dynamic Reference Lines, Calculated Fields & Inheritance
In the world of data visualization, there's a big difference between showing information and creating an experience. While traditional reports simply display data, truly powerful dashboards invite users to interact, explore, and discover insights on their own terms.
That's where Looker Studio parameters come in. They transform your static reports into dynamic tools that respond to user input, creating personalized experiences that make data more relevant and actionable than ever before.
In this post, we'll explore three powerful ways to leverage parameters in your Looker Studio reports:
Using parameters to create dynamic reference lines in your charts
Building calculated fields that respond to user input
Understanding parameter inheritance to control where and how parameters take effect
Let's dive in!
Dynamic Reference Lines: Turning Targets into Visual Guides
Have you ever presented a performance report only to hear, "But what if our target was different?" With parameter-driven reference lines, you can empower your audience to set their own benchmarks on the fly.
What Are Reference Lines?
Reference lines are horizontal or vertical lines that provide context on a chart. They can represent targets, averages, thresholds, or any other benchmark that helps interpret the data. Traditionally, these values were hardcoded by the report creator, but with parameters, they become interactive.
Setting Up Dynamic Reference Lines
Here's how to implement this in your own reports:
Create a numeric parameter in your data source (e.g., "Daily Revenue Target")
Add a control to your report (like an input box or slider) and link it to this parameter
Apply the parameter to a chart's reference line:
Select your chart (time series, bar chart, etc.)
Navigate to the Style panel
Find the Reference Lines section and add a new line
Instead of choosing "Constant value," select "Parameter"
Choose your parameter from the dropdown
Now when viewers adjust the parameter through your control, the reference line shifts instantly, giving them immediate visual feedback on how the data compares to their specific benchmark.
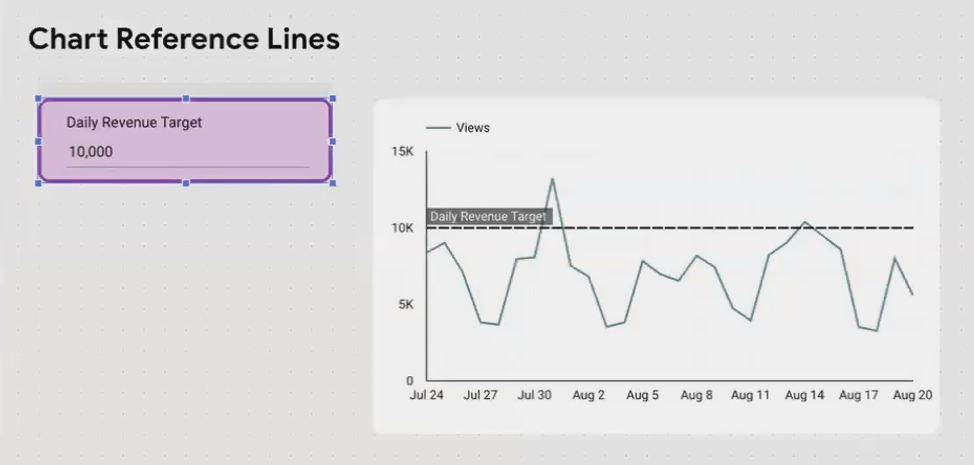
A time series chart with a parameter-driven reference line that shifts based on the "Daily Revenue Target" input by the user.
The Power of Visual Context
What makes this approach so effective is the immediate visual impact. When a user changes their target from $8,000 to $10,000, they can instantly see which days hit the mark and which fell short. This creates a much richer understanding than simply comparing numbers in a table.
As one Looker Studio expert puts it: "Dynamic reference lines transform 'what happened' reporting into 'how are we doing against what matters to us' analysis."
Calculated Fields: Where User Input Meets Live Data
While reference lines help interpret existing data, calculated fields take things a step further by actually transforming data based on user input. This is where parameters truly shine.
Beyond Simple Displays
A calculated field combines formulas with parameters to create new metrics that respond to user input. Here's where the magic happens: we can blend real-time data from our sources with situational values provided by the viewer.
Real-World Examples
Let's explore some powerful use cases:
1. Profit Calculations Based on User-Defined Margins
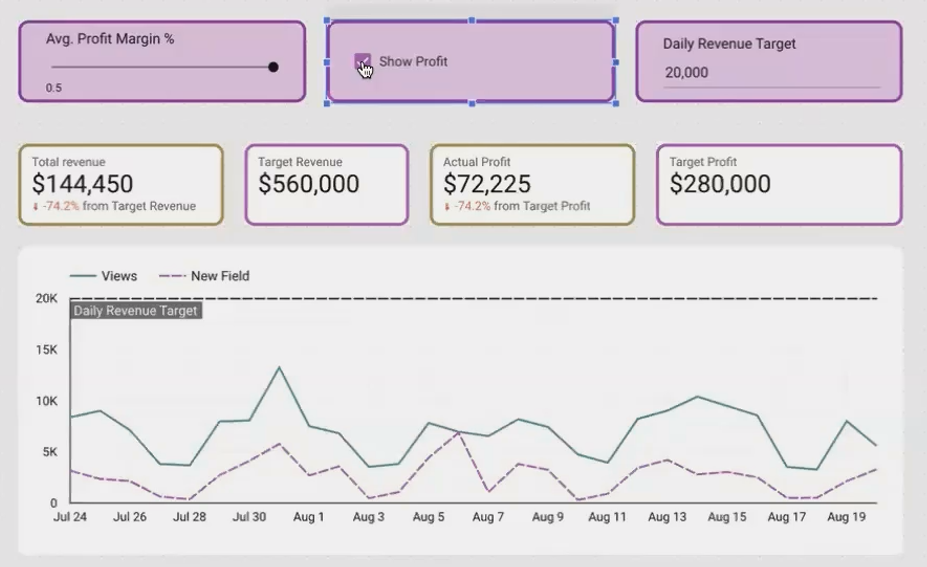
Imagine your data source contains revenue figures, but profit margins vary by product line or change over time. Create an "Average Profit Margin" parameter (decimal type), then build a calculated field with:
Total Revenue * Average Profit MarginNow users can adjust the profit margin parameter to see how different scenarios impact the bottom line.
2. Conditional Display Using Boolean Parameters
Want to give users control over what metrics appear on a chart? Create a "Show Profit" boolean parameter and connect it to a checkbox control. Then create a calculated field like:
CASE
  WHEN Show Profit THEN Total Revenue * Average Profit Margin
  ELSE NULL
END
This formula uses the CASE statement to show profit calculations only when the checkbox is ticked. When it's unchecked, the formula returns NULL, effectively hiding the profit line from your chart. (Just make sure your chart's "Missing Data" setting is configured to display line breaks or no line at all.)
3. Advanced ROI Calculators
For the ultimate interactive experience, you can build complex ROI calculators that combine multiple parameters:
CASE
  WHEN Show Profit THEN
    (Total Revenue * (1 + Revenue Growth Rate / 100)) * Average Profit Margin - Project Cost
  ELSE NULL
END
With this approach, users can simulate different business scenarios by adjusting growth rates, profit margins, and costs – all while working with your actual baseline data.
Avoiding Common Pitfalls
When working with calculated fields based on parameters, keep these tips in mind:
Test formulas thoroughly with different parameter values
Add clear labels to controls so users understand what they're adjusting
Consider adding default values that reflect typical scenarios
Be mindful of performance when creating complex calculations
Parameter Inheritance: Controlling When and Where Parameters Apply
Understanding parameter inheritance is crucial for creating sophisticated, multi-level reports. Similar to how filters work, parameters follow a hierarchy that determines which value takes precedence when there are conflicts.
The Parameter Inheritance Hierarchy
Parameters follow this precedence order (from highest to lowest priority):
Chart level (applies to a single visualization)
Group level (applies to a grouped set of elements)
Page level (applies to an entire report page)
Report level (applies to the entire report)
Data source level (the default value defined when creating the parameter)
When a parameter value is set at multiple levels, the most specific (highest in the list above) wins.
Practical Applications of Parameter Inheritance
This hierarchy creates powerful possibilities for report design:
Different Defaults for Different Pages
You can create specialized pages with different parameter defaults. For example:
Page 1: Conservative projections (10% growth rate)
Page 2: Moderate projections (20% growth rate)
Page 3: Aggressive projections (30% growth rate)
Users can then toggle between these scenarios simply by navigating between pages.
Overriding Parameters at the Chart Level
Sometimes you want most charts to respond to user input, but certain visualizations should maintain fixed values regardless of user changes. By setting a parameter value at the chart level, you can override whatever value the user selects in the controls.
To do this:
Select the specific chart
Navigate to the Setup tab
Scroll down to find the parameter settings
Override the default with your fixed value
Creating Comparison Views
One of the most powerful applications is creating comparison views. Imagine a dashboard with two identical charts side by side, but with different parameter values set at the chart level. This allows users to directly compare scenarios without having to remember what the previous view looked like.
Real-World Example: Multi-Level Parameter Application
Consider this scenario: You've created a sales dashboard with a "Revenue Target" parameter. Here's how you might apply it at different levels:
Data Source Level: Default target of $10,000 (baseline for all reports)
Report Level: Override to $12,000 for this specific quarterly report
Page Level: First page shows actual figures ($12,000 target), second page shows "stretch goal" with $15,000 target
Group Level: A group of charts focused on top performers uses $20,000 target
Chart Level: A historical comparison chart maintains the original $10,000 target regardless of user changes
As of 2025, this functionality has become even more powerful with the latest Looker Studio updates, giving report creators unprecedented control over parameter behavior throughout their dashboards.
Frequently Asked Questions (FAQs)
Can I use a parameter in a reference line on any type of chart?
No, reference lines are only available on certain chart types, including time series, bar charts, column charts, and scatter charts. They're not available on pie charts, tables, or scorecards.
Why does my numeric parameter from GA4 break when I try to display it on a scorecard?
This is a known quirk with GA4 data sources. Looker Studio tries to query the data source even for parameters. The workaround is to create a formula like NARY_MIN(Event Count, 1) * [Your Parameter] to force a data fetch while still displaying your parameter value.
Can I have different parameter controls on different pages affecting the same parameter?
Yes! You can have multiple controls linked to the same parameter across different pages. Just be aware of the inheritance rules – a value set on Page 2 won't affect charts on Page 1 unless you navigate to Page 2 first and set the value.
If I set a parameter value at the chart level, can users still override it with a control?
No, chart-level parameter settings have the highest precedence and will override any user input from controls. This is useful when you want certain charts to maintain fixed values regardless of user interaction.
By mastering parameters in Looker Studio, you're no longer just creating reports – you're building interactive tools that empower your audience to explore data on their own terms. Dynamic reference lines, calculated fields, and strategic parameter inheritance transform static dashboards into engaging analytical experiences.
The most successful Looker Studio creators understand that true data storytelling isn't about presenting a single narrative, but rather enabling users to discover the stories most relevant to their specific questions and contexts.
As you implement these techniques in your own reports, remember that the goal is to find the perfect balance between guided analysis and user freedom. Your expertise sets the foundation, while parameters give your audience the power to make the insights truly their own.
Note:
This post is based on a subject covered in the Looker Studio Masterclass Program. To learn more about Looker Studio Masterclass, click here.