
How to Use Looker Studio Parameters to Create Dynamic, Interactive Dashboards
Have you ever created what you thought was the perfect report, only to have stakeholders ask: "But what if our target was higher?" or "Can we see how this would look with a different profit margin?" Static reports can't answer these "what-if" questions but with Looker Studio parameters, your reports can become dynamic, interactive tools that empower viewers to explore data on their own terms.
For years, Looker Studio was a one-way street: we connected to data, transformed it, and visualized it for passive consumption. Viewers could filter or change date ranges, but they couldn't inject their own context or assumptions. Parameters changed everything by giving your audience a voice in the analysis.
In this guide, we'll explore how to use parameters to transform your reports from static presentations into dynamic, interactive experiences. Let's dive in!
What Are Parameters and Why Should You Care?
Parameters are like empty containers waiting to be filled with values provided by your report viewers. They're the first genuine way for your audience to have input that directly affects calculations in your reports.
Imagine you're analyzing sales performance. Your data source tells you the actual revenue, but what about the target? With parameters, viewers can enter their own targets, and your report can dynamically calculate and visualize the variance.
Parameters open up a world of possibilities:
Personalized analysis: Let viewers input their own targets, thresholds, or assumptions
What-if scenarios: Enable stakeholders to model different business outcomes
Custom filtering: Create flexible search functionality across multiple dimensions
Interactive forecasting: Build calculators that combine live data with user inputs
The Anatomy of a Parameter
Before we start creating parameters, let's understand their key components:
Name: What your viewers will see (e.g., "Daily Revenue Target")
Parameter ID: The internal identifier used in formulas (e.g.,
daily_revenue_target)Data Type: The kind of data it accepts (Text, Number, Boolean)
Permitted Values: What values viewers can enter (any value, a range, or a predefined list)
Default Value: The initial value before viewer interaction
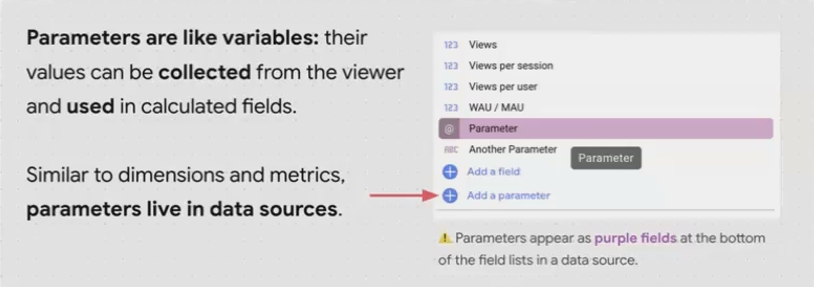
Parameters live in your data source, not in your report. This means they appear at the bottom of your field list (in purple) and can be used across any report that uses that data source.
Defining Parameters: A Step-by-Step Guide
Let's walk through creating different types of parameters for common business scenarios:
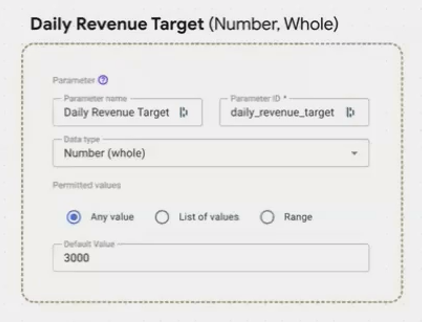
1. Creating a Numeric Parameter
Numeric parameters are perfect for targets, thresholds, or any scenario where you need a number from your viewers.
Step-by-step:
Open your data source for editing
Scroll to the bottom of your field list
Click "Add a parameter"
Enter a name (e.g., "Daily Revenue Target")
Select "Number" as the data type (choose "Whole" or "Decimal" as needed)
Choose "Any value" or set a min/max range
Set a default value
Click "Save" (don't forget this crucial step!)
Click "Done"
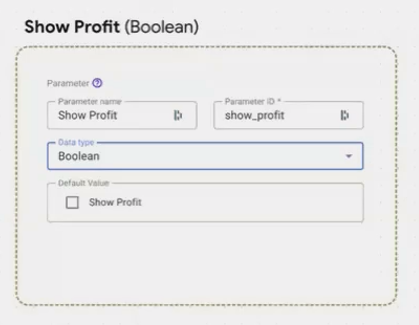
2. Creating a Boolean Parameter
Boolean parameters are ideal for simple yes/no toggles, like showing/hiding additional data.
Step-by-step:
Follow steps 1-3 above
Name your parameter (e.g., "Show Profit")
Select "Boolean" as the data type
Set the default to checked (true) or unchecked (false)
Save and finish
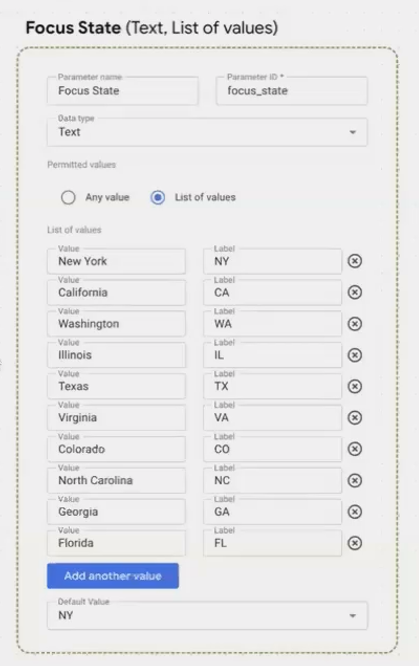
3. Creating a Text Parameter with a List of Values
Text parameters with predefined lists work great for selecting categories, regions, or any dimension with a finite set of options.
Step-by-step:
Follow steps 1-3 above
Name your parameter (e.g., "Focus State")
Select "Text" as the data type
Choose "List of values"
Add each value, providing both:
Value: The actual data used in calculations (e.g., "California")
Label: What users see in the dropdown (e.g., "CA")
Set a default selection
Save and finish
Pro tip: The order of values can't be changed after creation, so plan your list carefully!
Collecting Viewer Input: The Right Control for Each Parameter
Once you've defined parameters, you need a way for viewers to interact with them. Looker Studio offers different controls perfectly suited to each parameter type:
Input Boxes for Free-Form Entry
Input boxes are simple text fields that accept any value within your parameter's constraints.
Best for:
Numeric parameters accepting any value
Text parameters for search queries or custom input
Setup:
Add an "Input box" control to your report
In the control properties, drag your parameter to the "Control field"
The input box will display the parameter's default value
Sliders for Numeric Ranges
Sliders provide a visual way to select a number within a defined range.
Best for:
Numeric parameters with a min/max range
Values where the relationship between positions is important (like percentages)
Setup:
Add a "Slider" control to your report
In the control properties, drag your numeric parameter to the "Control field"
The slider automatically adjusts to your parameter's range
Dropdown Lists for Predefined Options
Dropdown menus present a clean list of options for selection.
Best for:
Text parameters with a list of permitted values
When you want to control exactly what values users can select
Setup:
Add a "Drop-down list" control to your report
In the control properties, drag your text parameter to the "Control field"
The dropdown will populate with the labels you defined for each value
Checkboxes for Boolean Values
Checkboxes provide a simple on/off toggle.
Best for:
Boolean parameters to show/hide content
Simple true/false selections
Setup:
Add a "Checkbox" control to your report
In the control properties, drag your Boolean parameter to the "Control field"
Displaying Parameter Values in Your Report
After collecting input, you'll often want to display the parameter values somewhere in your report. There are several ways to do this:
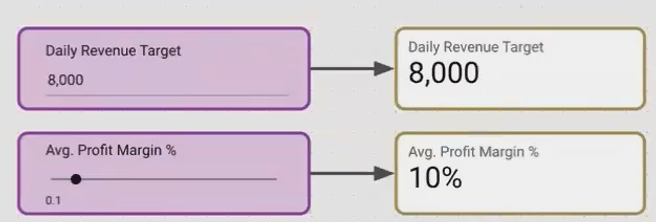
1. Direct Display on Scorecards
For numeric parameters, scorecards are the most straightforward option:
Add a scorecard to your report
Drag your parameter to the metric field
The scorecard will display the current parameter value
Important GA4 Workaround: If you're using GA4 data sources, you may encounter a "Failed to fetch data" error when trying to display parameters directly. This happens because Looker Studio insists on querying the data source even for parameter values.
The solution is to create a formula that forces a data fetch:
NARY_MIN(Event Count, 1) * [Your Parameter Name]This formula fetches an irrelevant metric from GA4, calculates a value that equals 1, and multiplies it by your parameter. The result displays correctly on your scorecard.
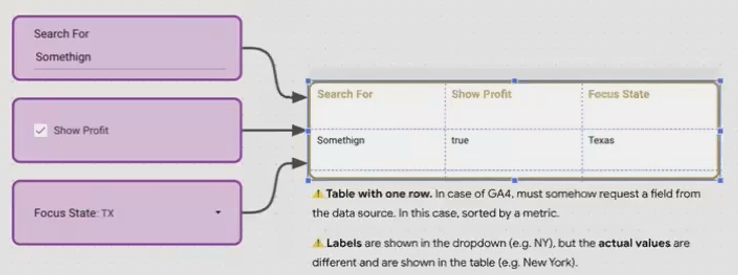
2. Showing Text and Boolean Parameters in Tables
For text and Boolean parameters, tables work best:
Add a table to your report
Add your parameters as dimensions
The table will display the current values
3. Using Parameters in Chart Titles and Labels
You can also incorporate parameter values into chart titles and descriptions using the TEXT function:
"Revenue vs Target (" + TEXT(Daily Revenue Target) + ")"This dynamically updates your chart title to reflect the current target value.
Frequently Asked Questions (FAQs)
Why does my parameter display break on scorecards with GA4 data?
Looker Studio tries to query GA4 for parameter values, which causes errors. Use the workaround formula: NARY_MIN(Event Count, 1) * [Your Parameter] to force a successful data fetch.
Can I use the same parameter across multiple pages?
Yes! Parameters live in the data source, so they're available throughout your report. Just remember that controls on one page will change the parameter value for all pages unless you set page-level overrides.
How do I choose between "Any value" and a "List of values" for my text parameter?
If your users need to enter unique text (like search terms), choose "Any value." If they're selecting from a finite set of options (like states or categories), use a "List of values" for a cleaner experience.
Can I change the order of values in my parameter list after creation?
Unfortunately, no. The order is fixed when you create the parameter, so plan carefully before saving.
What's new with parameters in 2025?
The latest Looker Studio updates have introduced Query Result Variables (also known as "Chips"), which complement parameters by allowing you to display dynamic data points directly in text. This feature enhances how you can present parameter-driven insights in your reports.
What's Next: Taking Parameters to the Next Level
Now that you understand the basics of creating and displaying parameters, you're ready to dive deeper into advanced applications. In our next article, we'll explore how to:
Use parameters in calculated fields to create dynamic metrics
Build dynamic reference lines on charts based on user targets
Create conditional visibility using Boolean parameters
Develop custom calculators that combine live data with user inputs
Parameters transform Looker Studio from a reporting tool into an interactive analytics platform. They're the secret to building reports that truly engage your audience by responding to their specific needs and questions.
Start experimenting today; your stakeholders will thank you for reports that finally answer their "what if" questions!
Note:
This post is based on a subject covered in the Looker Studio Masterclass Program. To learn more about Looker Studio Masterclass, click here.