
BigQuery for Looker Studio: A Complete Guide to Data Transformation & Visualization
If you've made the leap from basic Looker Studio connections to BigQuery, congratulations! You've unlocked a new level of data power. But now comes the exciting part: actually working with your data in BigQuery and connecting it back to Looker Studio for beautiful visualizations.
In this guide, we'll explore how to transform your raw data into valuable insights using SQL and then seamlessly connect those insights to Looker Studio. Whether you're a marketer who's never seen a line of code or an analyst looking to level up your skills, this post will give you practical knowledge you can apply immediately.
Working with Data in BigQuery: Your Transformation Toolkit
Once your data is safely stored in BigQuery, the real magic begins. BigQuery gives you several powerful tools to transform, analyze, and derive insights from your data.
SQL: The Universal Language of Data
The primary way to work with data in BigQuery is through SQL (Structured Query Language). Don't let the technical name intimidate you – SQL is actually quite intuitive and reads almost like English once you understand the basics.
With SQL in BigQuery, you can:
Query data: Retrieve exactly the information you need
Join tables: Combine data from multiple sources (like merging your Google Ads and GA4 data)
Clean data: Fix formatting issues, handle missing values, or standardize information
Process text: Transform, extract, or manipulate text fields with string functions
Analyze patterns: Use window functions and aggregations to discover trends and outliers
SQL has been around for over 50 years, which means it's stable, well-documented, and used by millions of professionals. Learning SQL basics is one of the most valuable investments you can make in your data career.
A Simple SQL Example Anyone Can Understand
Let's demystify SQL with a straightforward example. Imagine you have this simple table of product sales data:

Your boss asks: "What was our profit (not sales) for just eBooks and Courses in Q1 of 2024?"
Here's the SQL to answer that question:
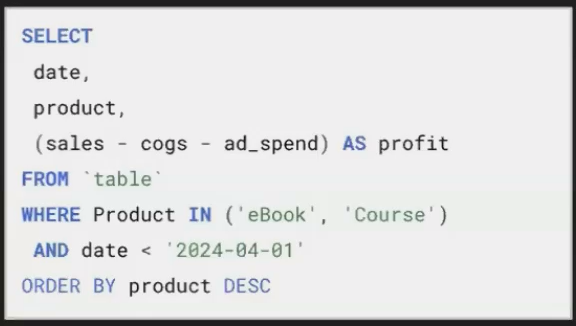
Breaking it down:
SELECT date, product, sales - cogs - ad_spend AS profit: Choose which columns to show, including a calculated profit columnFROM: Specify which table contains our dataWHERE: Filter rows to only eBooks and Courses before April 2024ORDER BY: Sort the results by product name and then by date
The result would be:

Even if you've never written SQL before, you can probably understand what this query is doing. That's the beauty of SQL – it's structured and logical.
Beyond SQL: BigQuery ML and Python
While SQL is the foundation, BigQuery offers advanced capabilities for those ready to go further:
BigQuery ML: Train and run machine learning models directly in BigQuery using SQL-like syntax – no data science degree required! You can build models for customer segmentation, purchase prediction, or sales forecasting.
Python with BigQuery: For those with programming experience, you can use Python within BigQuery notebooks to perform advanced analytics, create visualizations, or leverage popular data science libraries.
These advanced features allow you to grow with the platform as your skills develop, without needing to migrate to new tools.
Connecting Looker Studio to BigQuery: Visualizing Your Insights
After transforming your data in BigQuery, you'll want to visualize it in Looker Studio to create impactful dashboards and reports. The good news is that this connection is seamless, free, and incredibly powerful.
There are two primary methods for connecting Looker Studio to BigQuery:
Method 1: Direct Table Connection
The simplest approach is connecting directly to a BigQuery table or view:
In Looker Studio, click "Add Data" and select "BigQuery" as your connector
Choose your Google Cloud project, dataset, and table
Click "Add" and start building your visualizations
This method works exactly like connecting to a Google Sheet. The connection is live, so as your BigQuery table updates, your Looker Studio report automatically refreshes (subject to the data freshness settings you configure).
Method 2: Custom SQL Query
For more flexibility, you can write a custom SQL query:
In Looker Studio, click "Add Data" and select "BigQuery" as your connector
Click the "Custom Query" option
Write your SQL query to extract precisely the data you need
Click "Add" to use the query results in your report
The custom query approach offers two major advantages:
Data Efficiency: You can limit exactly which fields and rows come into your report, potentially improving performance
Dynamic Parameters: You can incorporate report parameters (like date range controls) into your query, making your data pulls dynamic and user-controlled
Quick Tip: Exploring Query Results
Here's a pro tip: After running a query in BigQuery, you can click "Explore with Looker Studio" to instantly create a new report with your query results. This is perfect for quickly visualizing the output of a complex query without having to manually set up the connection.
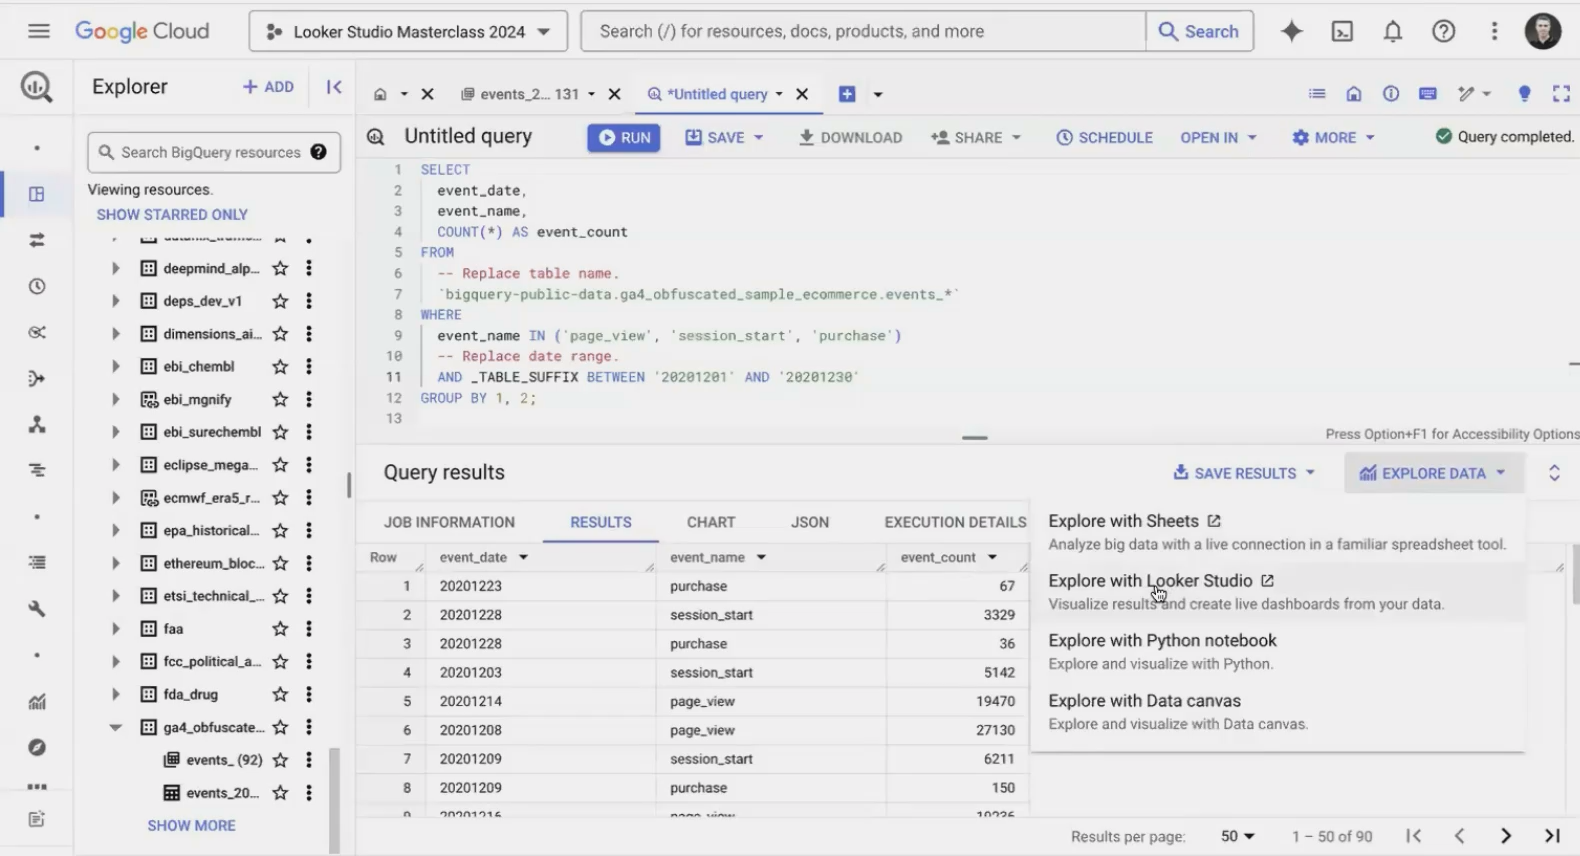
The "Explore with Looker Studio" button creates an instant connection between your query results and a new Looker Studio report.
Best Practices for BigQuery-Powered Looker Studio Reports
To get the most out of your BigQuery and Looker Studio integration, follow these best practices:
Create Views for Complex Queries: Instead of copying the same complex SQL into multiple reports, create a view in BigQuery. Views are like saved queries that behave like tables.
Use BI Engine for Speed: For frequently accessed data, consider enabling BigQuery BI Engine, which provides lightning-fast response times by caching your data in memory.
Partition Your Tables: For large datasets, use partitioning to divide your tables into smaller chunks (typically by date). This dramatically reduces query costs and improves performance.
Limit Data at the Source: Filter data in your BigQuery query rather than in Looker Studio to minimize the amount of data transferred between the two platforms.
Leverage Scheduled Queries: For complex transformations that you run regularly, set up scheduled queries in BigQuery to refresh derived tables automatically.
Frequently Asked Questions (FAQs)
Is BigQuery SQL different from standard SQL?
BigQuery uses standard SQL with some Google-specific extensions and functions. If you know SQL from other databases, you'll find it very familiar. BigQuery previously had a legacy SQL dialect, but the standard SQL version is now recommended for all new development.
What if I don't know SQL but want to use BigQuery?
You have several options: 1) Start with the basics – SQL isn't as difficult as it might seem; 2) Use AI tools like ChatGPT to help write queries, though you should verify the results; 3) Use BigQuery's visual query builder for simple operations; or 4) Partner with someone who knows SQL while you learn.
Does the Looker Studio-BigQuery connection cost anything?
The connection itself is free. You only pay for the BigQuery storage and query costs according to Google Cloud's pricing. Remember that the first 10GB of storage and 1TB of queries per month are free, which is generous for getting started.
How quickly does Looker Studio refresh data from BigQuery?
By default, Looker Studio caches data for 12 hours. You can adjust this in the data source settings to be as frequent as every minute. Keep in mind that more frequent refreshes may increase your BigQuery costs if your queries process large amounts of data.
Can I use BigQuery ML results in Looker Studio?
Absolutely! After creating a model in BigQuery ML, you can use the prediction results just like any other data table. This allows you to create dashboards with sophisticated ML-powered insights like customer segments, predicted values, or anomaly detection.
Working with data in BigQuery and connecting it to Looker Studio opens up a world of possibilities that simply aren't available with direct data connections or Google Sheets-based pipelines. You now have the power to handle virtually unlimited data volumes, perform sophisticated transformations, and create blazing-fast dashboards.
The learning curve might seem steep if you're new to SQL, but the investment is well worth it. Start small, practice regularly, and you'll be surprised at how quickly you can progress from basic queries to complex data models.
Remember that the BigQuery-Looker Studio combination gives you enterprise-grade data capabilities without enterprise-level complexity or costs. It's the same technology stack used by data teams at major companies, but accessible to individual analysts, marketers, and business owners.
So dive in, start querying, and watch as your data visualizations reach new heights of performance, sophistication, and insight!
Note:
This post is based on a subject covered in the Looker Studio Masterclass Program. To learn more about Looker Studio Masterclass, click here.