
How to Build a BigQuery Data Pipeline: Combine Search Console & GA4 Data for Revenue Insights
Have you ever wondered how to connect the dots between your website's search performance and actual revenue? In this guide, I'll walk you through creating a powerful data pipeline that answers exactly that question. We'll focus on the two crucial first steps: bringing your data into BigQuery and transforming it into meaningful insights.
By the end of this tutorial, you'll know how to connect multiple data sources and use SQL to reveal which search queries are driving the most value for your business. Let's dive in!
Why Build a Data Pipeline in BigQuery?
Before we get our hands dirty with code, let's understand what we're trying to achieve. A data pipeline is essentially a series of data processing steps that takes raw data from various sources, cleans it, transforms it, and prepares it for analysis.
For businesses with a web presence, one of the most valuable analyses is understanding which search queries bring not just traffic, but actual revenue. This requires connecting data from:
Google Search Console: Shows which queries drive impressions and clicks
Google Analytics: Shows which landing pages generate sessions, conversions, and revenue
By combining these data sources in BigQuery, we can perform powerful attribution analysis that's simply not possible in the original platforms.
Bringing Data into BigQuery
The Data Sources We'll Use
For this tutorial, we'll work with two data sources:
Google Analytics 4 data exported to a Google Sheet
Google Search Console data already in BigQuery through its data transfer service
Both datasets contain one month (October) of data from the Looker Studio Masterclass website.
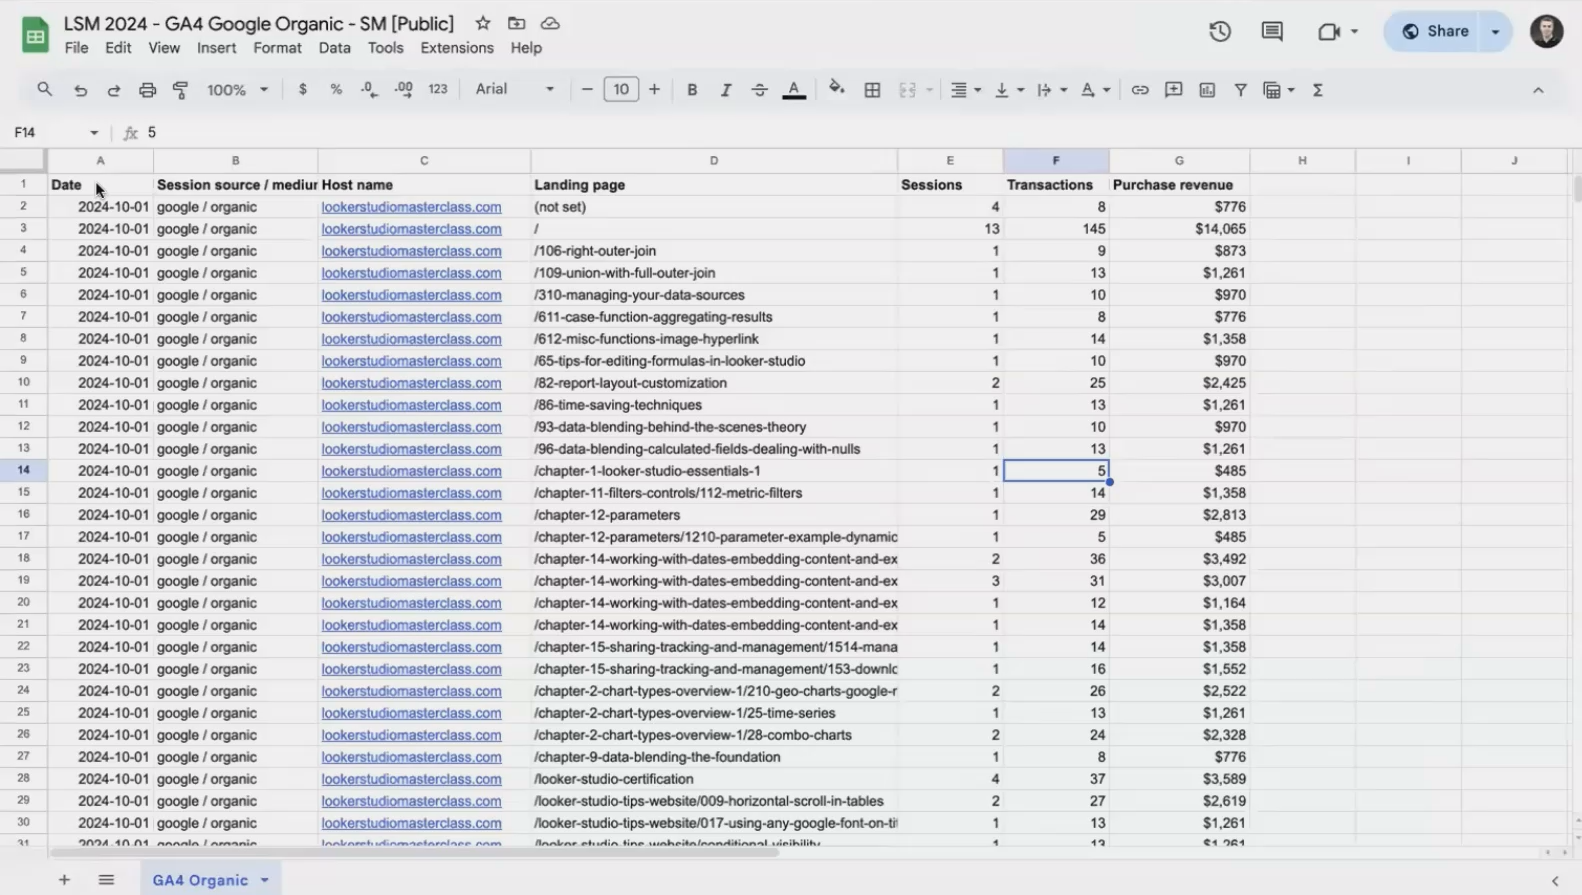
Our GA4 data contains date, session source, landing page, sessions, transactions, and revenue information
Method 1: Using Google Search Console's Data Transfer Service
Google Search Console offers a native data transfer service that automatically exports your performance data to BigQuery daily. This is a recent addition (within the last couple of years) and is incredibly valuable.
To set this up for your own website:
In Google Search Console, navigate to Settings
Look for "BigQuery Export"
Follow the setup wizard to connect to your BigQuery project
Once configured, you'll have a continuously updating table with all your search performance metrics, including impressions, clicks, and positions for each query and URL.
Method 2: Creating an External Table from Google Sheets
For our GA4 data, we'll create what's called an "external table" in BigQuery. This is different from a standard table because:
The data remains in Google Sheets
The table is just a reference to that sheet
If the sheet updates, the table reflects those changes immediately
Here's how to create an external table:
In your BigQuery project, navigate to your dataset
Click the three dots menu and select "Create table"
For source, select "Drive" and paste your Google Sheet URL
Set "File format" to "Google Sheet"
Name your table (we'll use
GA_Organic)Check "Auto-detect schema" to let BigQuery figure out data types
Under "Advanced options," set "Header rows to skip" to 1
Click "Create table"
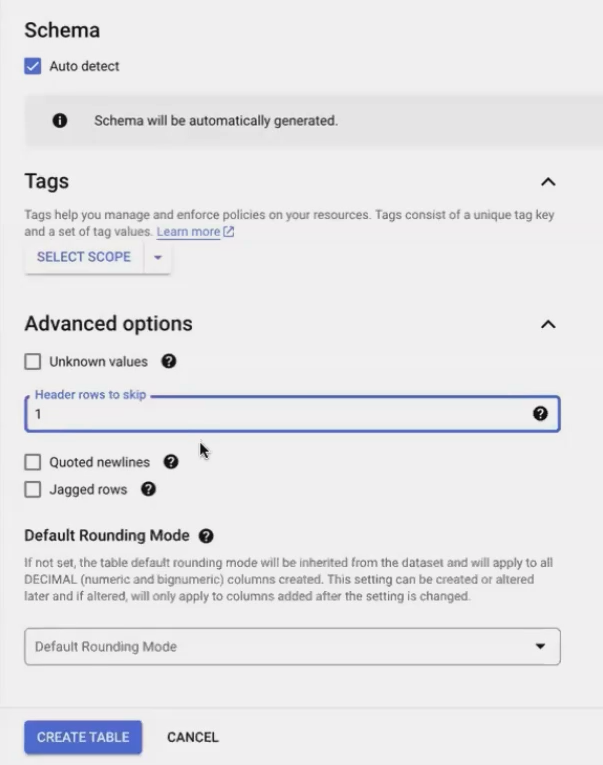
Creating an external table from a Google Sheet in BigQuery
Pro Tip: External tables are perfect for data that updates regularly in Google Sheets. If you use tools like Supermetrics or Google's native GA4 add-on to refresh your sheet daily, your BigQuery table will always have the latest data.
Testing Your Connections
Let's verify our data is accessible by running simple queries on both tables:
-- Query GA4 data
SELECT * FROM `your-project.your_dataset.GA_Organic`;

-- Query Search Console data
SELECT * FROM `your-project.your_dataset.Google_Search_Console`;
If both queries return data, congratulations! You've successfully brought two data sources into BigQuery. Now let's transform them into something useful.
Processing & Transforming Data
This is where the real magic happens. Raw data is rarely useful on its own - we need to clean, reshape, and combine it to unlock insights.
Step 1: Preparing the Search Console Data
First, let's prepare our Search Console data. We want to focus on queries that actually sent clicks to our site:
SELECT
  date,
  url,
  query,
  SUM(clicks) AS total_clicks
FROM
  `your-project.your_dataset.Google_Search_Console`
WHERE
  query IS NOT NULL  -- Remove anonymized queries
  AND clicks > 0     -- Only include queries that drove clicks
GROUP BY
  date, url, query
ORDER BY
  date, url         -- Keep results organized
This query:
Selects only the data we need
Filters out anonymized queries (where
queryis NULL)Excludes queries with zero clicks
Aggregates clicks by date, URL, and query
Organizes results chronologically and by URL
Now we have a clean table showing which queries drove traffic to which URLs on which days.
Step 2: Preparing the GA4 Data
Next, let's prepare our GA4 data. We need to select relevant columns and ensure URL formats will match our Search Console data:
SELECT
  date,
  CONCAT("https://", hostname, landing_page) AS url,  -- Create full URLs
  sessions,
  transactions,
  purchase_revenue
FROM
  `your-project.your_dataset.GA_Organic`
WHERE
  landing_page != '(not set)'  -- Remove rows with invalid landing pages
The CONCAT() function is crucial here - it formats our landing page data to match the URL format in Search Console. Without this, our join would fail due to mismatched keys.
Step 3: Using Common Table Expressions (CTEs) for Clarity
For complex transformations, Common Table Expressions (CTEs) are a game-changer. Think of them as temporary, named result sets that make your code more readable and modular.
Here's how we'll use CTEs to organize our query:
WITH GSC AS (
  -- Our Search Console preparation query goes here
),

GA AS (
  -- Our GA4 preparation query goes here
)

-- Our main query will reference these CTEs
SELECT * FROM GSC;  -- Just a placeholder for now
Pro Tip: CTEs make complex queries much easier to understand and debug. I always use them when joining multiple data sources or when a query has distinct logical steps.
Step 4: Joining the Datasets with LEFT JOIN
Now we'll combine our datasets using a LEFT JOIN. We'll use the Search Console data as our "left" table because:
We want to keep ALL search queries, even if they don't match a landing page in GA
We're trying to attribute GA metrics (sessions, revenue) to those search queries
WITH GSC AS (
  -- Search Console prep query
),

GA AS (
  -- GA4 prep query
)

SELECT
  GSC.date,
  GSC.url,
  GSC.query,
  GSC.total_clicks,
  GA.sessions,
  GA.transactions,
  GA.purchase_revenue
FROM
  GSC
LEFT JOIN
  GA
  ON GSC.date = GA.date
  AND GSC.url = GA.url
When we run this query, we immediately notice a problem. Many queries that we know drove traffic show NULL values for sessions and revenue. What's happening?
Troubleshooting: The URL Mismatch Problem
The most common join issue is mismatched keys. In our case, we thought we fixed our URL formats, but a closer inspection reveals:
GSC URL:
https://lookerstudiomasterclass.com/GA URL after CONCAT:
https://lookerstudiomasterclass.com/
They look identical, but there might be trailing slashes, capitalization differences, or other subtle mismatches. We need to ensure our URL formatting is consistent in both CTEs.
The "Fan-Out" Problem: When One Query Isn't Enough
After fixing our URLs, we run into a more subtle issue. When we look at our joined data, we see something like:
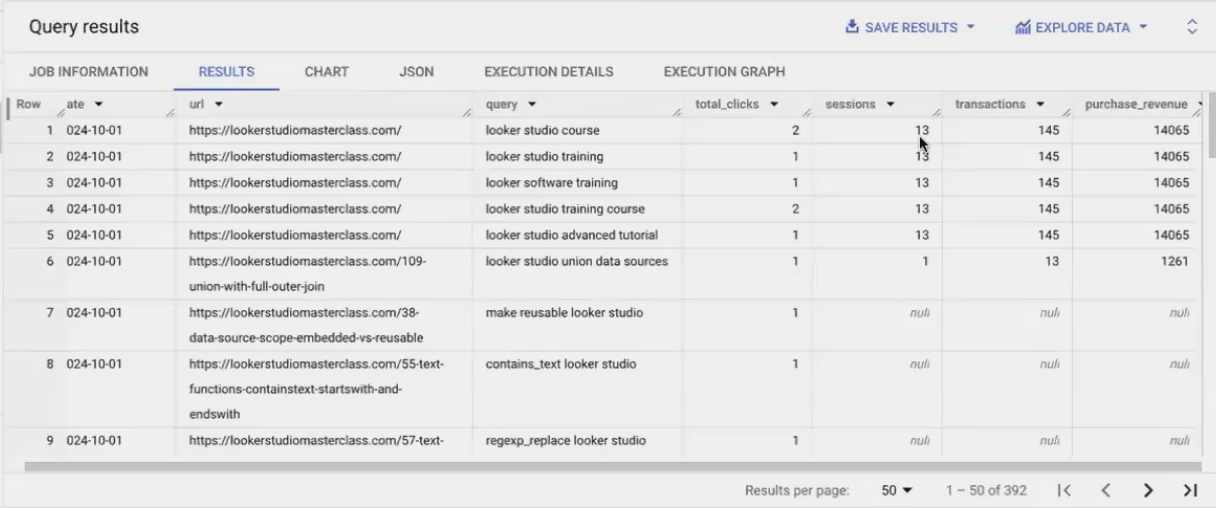
Wait - how can three different queries ALL be responsible for the SAME 13 sessions and $14,500 in revenue? This doesn't make sense!
The problem is a data granularity mismatch:
Our GSC data is at the query level (showing which queries drove clicks)
Our GA data is at the landing page level (showing total sessions and revenue for each page)
When we join them, each query gets "credited" with the FULL performance of the landing page. This is called a "fan-out" problem.
Solving the Fan-Out Problem with Window Functions
To solve this, we need to distribute the credit proportionally. If a query drove 2 out of 7 total clicks to a page, it should get 2/7ths of the sessions and revenue.
This is where window functions come in. Window functions perform calculations across a set of table rows related to the current row, without collapsing those rows like a GROUP BY would.
Here's our approach:
Calculate the total clicks for each URL on each day
Calculate each query's share of those clicks
Multiply GA metrics by that share to get attributed values
WITH GSC_step_1 AS (
  -- Our initial GSC query
),

GSC_step_2 AS (
  SELECT
    *,
    SUM(total_clicks) OVER (PARTITION BY date, url) AS total_url_clicks,
    total_clicks / SUM(total_clicks) OVER (PARTITION BY date, url) AS share_of_clicks
  FROM
    GSC_step_1
),

GA AS (
  -- Our GA4 query
)

SELECT
  GSC.date,
  GSC.url,
  GSC.query,
  GSC.total_clicks,
  GSC.share_of_clicks,
  GA.sessions * GSC.share_of_clicks AS attributed_sessions,
  GA.transactions * GSC.share_of_clicks AS attributed_transactions,
  GA.purchase_revenue * GSC.share_of_clicks AS attributed_revenue
FROM
  GSC_step_2 AS GSC
LEFT JOIN
  GA
  ON GSC.date = GA.date
  AND GSC.url = GA.url
Now our attribution looks logical:

Each query gets credit proportional to the clicks it drove. The sum of attributed sessions equals the original 13 sessions, and the revenue distribution makes sense.
Frequently Asked Questions (FAQs)
Can I use BigQuery as a freelancer, or is it only for large companies with in-house teams?
BigQuery is absolutely suitable for freelancers and small agencies! You can help clients set up their BigQuery pipelines while they own the project and pay the (often minimal) costs. I started using BigQuery as a freelancer when a client had too much data for Google Sheets. It's a valuable service to offer clients of any size.
What's the role of tools like Stitch or DBT when I can transfer data directly from Sheets to BigQuery?
Tools like Stitch and Fivetran are valuable when you need to bring data from sources without native BigQuery connectors (like Facebook Ads or Shopify). DBT and similar tools help manage complex transformation workflows with versioning and testing. For simpler projects like ours, BigQuery's native capabilities are often sufficient.
For services like Google Ads that create many tables and views, which should I use?
If Google creates views as part of their data transfer, start with those views as your base. They typically include helpful initial transformations. Examine the underlying query of the view to understand what it's doing, then build your additional transformations on top.
What about BigQuery's "Workflows" feature?
The Workflows feature, powered by Dataform, provides a visual way to design data pipelines. It's extremely promising for managing complex data flows and making your processes more transparent. While I still use scheduled queries for existing projects, I'd strongly consider Workflows for new initiatives.
In this guide, we've covered the crucial first steps of building a data pipeline in BigQuery: bringing in your data and transforming it into actionable insights. We've learned how to:
Create an external table from Google Sheets
Use Google Search Console's native BigQuery export
Clean and prepare our data using SQL
Join datasets with proper key matching
Solve the "fan-out" problem with window functions
Properly attribute website performance to search queries
This foundation allows you to answer the critical business question: "Which search queries are driving the most revenue for my website?"
In the next part of this series, we'll explore how to save our analysis as tables, views, or scheduled queries, and how to visualize the results in Looker Studio. Stay tuned!
Note:
This post is based on a subject covered in the Looker Studio Masterclass Program. To learn more about Looker Studio Masterclass, click here.